Evidence for an evolutionary relationship between the large adaptor nucleoporin Nup192 and karyopherins - PubMed (original) (raw)
Evidence for an evolutionary relationship between the large adaptor nucleoporin Nup192 and karyopherins
Tobias Stuwe et al. Proc Natl Acad Sci U S A. 2014.
Abstract
Nucleocytoplasmic transport is facilitated by nuclear pore complexes (NPCs), which are massive proteinaceous transport channels embedded in the nuclear envelope. Nup192 is a major component of an adaptor nucleoporin subcomplex proposed to link the NPC coat with the central transport channel. Here, we present the structure of the ∼110-kDa N-terminal domain (NTD) of Nup192 at 2.7-Å resolution. The structure reveals an open ring-shaped architecture composed of Huntingtin, EF3, PP2A, and TOR1 (HEAT) and Armadillo (ARM) repeats. A comparison of different conformations indicates that the NTD consists of two rigid halves connected by a flexible hinge. Unexpectedly, the two halves of the ring are structurally related to karyopherin-α (Kap-α) and β-karyopherin family members. Biochemically, we identify a conserved patch that binds an unstructured segment in Nup53 and show that a C-terminal tail region binds to a putative helical fragment in Nic96. The Nup53 segment that binds Nup192 is a classical nuclear localization-like sequence that interacts with Kap-α in a mutually exclusive and mechanistically distinct manner. The disruption of the Nup53 and Nic96 binding sites in vivo yields growth and mRNA export defects, revealing their critical role in proper NPC function. Surprisingly, both interactions are dispensable for NPC localization, suggesting that Nup192 possesses another nucleoporin interaction partner. These data indicate that the structured domains in the adaptor nucleoporin complex are held together by peptide interactions that resemble those found in karyopherin•cargo complexes and support the proposal that the adaptor nucleoporins arose from ancestral karyopherins.
Keywords: X-ray crystallography; mega assembly; site-directed mutagenesis; structure-function analysis.
Conflict of interest statement
The authors declare no conflict of interest.
Figures
Fig. 1.
Structural overview of the NTD of ctNup192. (A) Domain structure of ctNup192 (crystallized fragment is indicated by a black bar). The N-terminal Head module (yellow), HEAT module (green), hinge module (red), ARM module (blue), and CTD (gray) are indicated. (B) Structure of ctNup192NTD shown in a cartoon representation using the same coloring scheme as in A. The hinge and α31–α32 loops, which line the inner arch of the ring, are colored in red and orange, respectively. Dashed lines indicate disordered loops.
Fig. 2.
Structural similarity of the ctNup192NTD ARM module to Kap-α. Overview of ctNup192NTD (Left) colored as in Fig. 1_B_, the Kap-α•bipartite-NLS complex (Center, gray and yellow; Protein Data Bank ID code 1EE5) (28), and their superposition (Right).
Fig. 3.
Surface properties of ctNup192NTD. (A) Surface representation of ctNup192NTD in four different orientations colored as in Fig. 1_B_. (B) Surface representation of ctNup192NTD colored according to conservation within seven fungal Nup192 sequences (
Fig. S2
). Sequence conservation is shaded from white (<45% similarity), to yellow (45% similarity), to red (100% identity). (C) Surface representation is colored according to electrostatic potential from −10 kBT/e (red) to +10 kBT/e (blue).
Fig. 4.
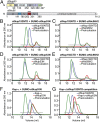
Biochemical interaction analysis. (A) Domain organization of ctNup53 and ctNic96. C, C-terminal segment; H, amphipathic helix; H1, Helix 1; H2, Helix 2; N, N-terminal segment; RRM, RNA-recognition motif domain; U, unstructured segment. Black bars highlight fragments used for interaction analysis. SEC analysis of ctNup192NTD with ctNup53N (B) or ctNic96H2 (C). SEC analysis of ctNup192CTD with ctNup53N (D) or ctNic96H2 (E). (F) SEC analysis of Kap-α with ctNup53N. (G) SEC analysis of competitive binding between Kap-α•ctNup53N and ctNup192NTD. Gray bars and colored lines designate the analyzed fractions in the respective SDS/PAGE gels stained with Coomassie brilliant blue (
Fig. S5 B_–_E, G, and H
).
Fig. 5.
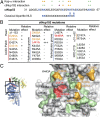
Mutational analysis of the ctNup53 interactions with ctNup192 and Kap-α. (A) Sequence comparison of ctNup5331–67 with a consensus classical bipartite NLS and summary of the effects of ctNup5331–67 mutations on ctNup192NTD and Kap-α binding. Basic residues are highlighted in blue, and dots indicate mutations that cause no effect (green), reduced binding (orange), or complete disruption (purple) (
Fig. S6 A and B
). (B) Mutational analysis of the ctNup192NTD–ctNup5331–67 interaction. Mutations that have no effect (−, black), reduce binding (+, orange), or abolish the interaction (+++, red) are indicated (
Fig. S7_A_
). (C, Right) Surface mapping of ctNup192NTD mutagenesis results. (C, Left) As a reference, a cartoon representation of ctNup192NTD, colored as in Fig. 1_B_, is shown. The locations of mutations on the ctNup192NTD surface are labeled and colored in green, orange, and red to indicate no effect, reduced binding, or complete disruption of ctNup5331–67 binding, respectively.
Fig. 6.
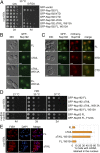
In vivo analyses of Nup192 and Nup53 mutants in S. cerevisiae. (A) The _nup192_Δ shuffle strain containing an mCherry-Nup192 cover plasmid (URA3) was transformed with control or GFP-Nup192 variants [leucine (Leu)]. Growth was followed on synthetic dextrose complete (SDC)-Leu and 5-fluoroorotic acid (5-FOA)/SDC plates for the indicated times and temperatures. FL, full-length. (B and C) In vivo localization of GFP-Nup192 variants in the _nup192_Δ strain visualized by fluorescence and differential interference contrast (DIC) microscopy. (C) Cells still carry the mCherry-Nup192 full-length plasmid. (D) Growth analysis of _nup192_Δ and _nup53_Δ_nup59_Δ strains. Cells were spotted on yeast extract peptone dextrose (YPD) plates and grown for 2–4 d at the indicated temperatures. (E) mRNA export assay of GFP-Nup192 variants. (Left) Representative images of WT GFP-Nup192– (Upper) and GFP-Nup192∆TAIL– (Lower) complemented _nup192_Δ cells are shown. (Right) Quantification of nuclear poly(A) mRNA retention is shown. Error bars indicate SDs derived from six independent images, each containing ∼100 cells. (Scale bars: 5 μm.)
Fig. 7.
Model for the ctNup192 interaction network. The structure of ctNup192NTD is docked into the EM envelope of full-length ctNup192 (21). The general locations of the interaction sites for Nup5331–67 (Upper) and Nic96H2 (Lower) on Nup192 are shown. The location of a yet to be identified nucleoporin interaction site is indicated.
Similar articles
- Architecture of the linker-scaffold in the nuclear pore.
Petrovic S, Samanta D, Perriches T, Bley CJ, Thierbach K, Brown B, Nie S, Mobbs GW, Stevens TA, Liu X, Tomaleri GP, Schaus L, Hoelz A. Petrovic S, et al. Science. 2022 Jun 10;376(6598):eabm9798. doi: 10.1126/science.abm9798. Epub 2022 Jun 10. Science. 2022. PMID: 35679425 Free PMC article. - Analysis of the yeast nucleoporin Nup188 reveals a conserved S-like structure with similarity to karyopherins.
Flemming D, Devos DP, Schwarz J, Amlacher S, Lutzmann M, Hurt E. Flemming D, et al. J Struct Biol. 2012 Jan;177(1):99-105. doi: 10.1016/j.jsb.2011.11.008. Epub 2011 Nov 22. J Struct Biol. 2012. PMID: 22138091 - Scaffold nucleoporins Nup188 and Nup192 share structural and functional properties with nuclear transport receptors.
Andersen KR, Onischenko E, Tang JH, Kumar P, Chen JZ, Ulrich A, Liphardt JT, Weis K, Schwartz TU. Andersen KR, et al. Elife. 2013 Jun 11;2:e00745. doi: 10.7554/eLife.00745. Elife. 2013. PMID: 23795296 Free PMC article. - Karyopherin flexibility in nucleocytoplasmic transport.
Conti E, Müller CW, Stewart M. Conti E, et al. Curr Opin Struct Biol. 2006 Apr;16(2):237-44. doi: 10.1016/j.sbi.2006.03.010. Epub 2006 Mar 29. Curr Opin Struct Biol. 2006. PMID: 16567089 Review. - Molecular mechanisms of nuclear protein transport.
Moroianu J. Moroianu J. Crit Rev Eukaryot Gene Expr. 1997;7(1-2):61-72. doi: 10.1615/critreveukargeneexpr.v7.i1-2.40. Crit Rev Eukaryot Gene Expr. 1997. PMID: 9034715 Review.
Cited by
- Evolutionary trajectory for nuclear functions of ciliary transport complex proteins.
Ewerling A, May-Simera HL. Ewerling A, et al. Microbiol Mol Biol Rev. 2024 Sep 26;88(3):e0000624. doi: 10.1128/mmbr.00006-24. Epub 2024 Jul 12. Microbiol Mol Biol Rev. 2024. PMID: 38995044 Review. - The Nuclear Pore Complex: Birth, Life, and Death of a Cellular Behemoth.
Dultz E, Wojtynek M, Medalia O, Onischenko E. Dultz E, et al. Cells. 2022 Apr 25;11(9):1456. doi: 10.3390/cells11091456. Cells. 2022. PMID: 35563762 Free PMC article. Review. - Nuclear transport proteins: structure, function, and disease relevance.
Yang Y, Guo L, Chen L, Gong B, Jia D, Sun Q. Yang Y, et al. Signal Transduct Target Ther. 2023 Nov 10;8(1):425. doi: 10.1038/s41392-023-01649-4. Signal Transduct Target Ther. 2023. PMID: 37945593 Free PMC article. Review. - The nuclear pore complex--structure and function at a glance.
Kabachinski G, Schwartz TU. Kabachinski G, et al. J Cell Sci. 2015 Feb 1;128(3):423-9. doi: 10.1242/jcs.083246. J Cell Sci. 2015. PMID: 26046137 Free PMC article. Review. - Pore timing: the evolutionary origins of the nucleus and nuclear pore complex.
Field MC, Rout MP. Field MC, et al. F1000Res. 2019 Apr 3;8:F1000 Faculty Rev-369. doi: 10.12688/f1000research.16402.1. eCollection 2019. F1000Res. 2019. PMID: 31001417 Free PMC article. Review.
References
- Cook A, Bono F, Jinek M, Conti E. Structural biology of nucleocytoplasmic transport. Annu Rev Biochem. 2007;76:647–671. - PubMed
- Hoelz A, Blobel G. Cell biology: Popping out of the nucleus. Nature. 2004;432(7019):815–816. - PubMed
- Debler EW, Blobel G, Hoelz A. Nuclear transport comes full circle. Nat Struct Mol Biol. 2009;16(5):457–459. - PubMed
Publication types
MeSH terms
Substances
LinkOut - more resources
Full Text Sources
Other Literature Sources
Molecular Biology Databases


