ISMARA: automated modeling of genomic signals as a democracy of regulatory motifs - PubMed (original) (raw)
ISMARA: automated modeling of genomic signals as a democracy of regulatory motifs
Piotr J Balwierz et al. Genome Res. 2014 May.
Abstract
Accurate reconstruction of the regulatory networks that control gene expression is one of the key current challenges in molecular biology. Although gene expression and chromatin state dynamics are ultimately encoded by constellations of binding sites recognized by regulators such as transcriptions factors (TFs) and microRNAs (miRNAs), our understanding of this regulatory code and its context-dependent read-out remains very limited. Given that there are thousands of potential regulators in mammals, it is not practical to use direct experimentation to identify which of these play a key role for a particular system of interest. We developed a methodology that models gene expression or chromatin modifications in terms of genome-wide predictions of regulatory sites and completely automated it into a web-based tool called ISMARA (Integrated System for Motif Activity Response Analysis). Given only gene expression or chromatin state data across a set of samples as input, ISMARA identifies the key TFs and miRNAs driving expression/chromatin changes and makes detailed predictions regarding their regulatory roles. These include predicted activities of the regulators across the samples, their genome-wide targets, enriched gene categories among the targets, and direct interactions between the regulators. Applying ISMARA to data sets from well-studied systems, we show that it consistently identifies known key regulators ab initio. We also present a number of novel predictions including regulatory interactions in innate immunity, a master regulator of mucociliary differentiation, TFs consistently disregulated in cancer, and TFs that mediate specific chromatin modifications.
Figures
Figure 1.
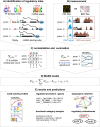
Outline of the Integrated System for Motif Activity Response Analysis. (A) ISMARA starts from a curated genome-wide collection of promoters and their associated transcripts. Using a comparative genomic Bayesian methodology (Arnold et al. 2012a), transcription factor binding sites (TFBSs) for ∼200 regulatory motifs are predicted in proximal promoters. Similarly, miRNA target sites for ∼100 seed families are annotated in the 3′ UTRs of transcripts associated with each promoter (Friedman et al. 2009). (B) Users provide measurements of gene expression (microarray, RNA-seq) or chromatin state (ChIP-seq). The raw data are processed automatically, and a signal is calculated for each promoter in each sample. For ChIP-seq data, the signal is calculated from the read density in a region around the transcription start. For gene expression data, the signal is calculated from read densities across the associated transcripts (RNA-seq) or intensities of associated probes (microarray). (C) The site predictions and measured signals are summarized in two large matrices. The components N pm of matrix N contain the total number of sites for motif m (TF or miRNA) associated with promoter p. The components E ps of matrix E contain the signal associated with promoter p in sample s. (D) The linear MARA model is used to explain the signal levels E ps in terms of bindings sites N pm and unknown motif activities A ms, which are inferred by the model. The constants c p and  correspond to basal levels for each promoter and sample, respectively. (E) As output, ISMARA provides the inferred motif activity profiles A ms of all motifs across the samples, s, sorted by the significance of the motifs. A sorted list of all predicted target promoters is provided for each motif, together with the network of known interactions between these targets (provided by the String database,
) and a list of Gene Ontology categories that are enriched among the predicted targets. Finally, for each motif, a local network of predicted direct regulatory interactions with other regulators is provided.
Figure 2.
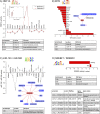
Results for the Illumina Body Map 2. Each panel corresponds to a motif (indicated with name and sequence logo) and shows the inferred motif activities across the 16 tissues (activities with error bars in panels A and C, and activity _Z_-values in panels B and D). Tables show Gene Ontology categories enriched among predicted targets of each motif, and individual target promoters (D). The networks (B,C) show direct regulatory interactions between the motif and other regulators. (A) Red and black curves correspond to motif activities from two replicate measurements. The inset shows the correlation between motif activity and HNF1A mRNA levels. (B) The inset shows that MYB is predicted to directly target the RFX4 promoter with target score 8.134. (C) The regulatory network inset and GO table show that hsa-miR-124/hsa-miR-506 is predicted to directly target many TFs. (D) The red bars show _Z_-values of the average motif activity of the SREBF motif for samples coming from older (age 58–86) and younger (age 19–47) donors.
Figure 3.
Analysis of an inflammatory response time series of human umbilical vein endothelial cells responding to TNF. (A) Time-dependent activities of the three most significant motifs, i.e., NFKB1/REL/RELA (red), IRF1/2/7 (black), and XBP1 (blue). Error bars denote standard deviations of the inferred activities. (B) Summary of the inferred core regulatory network. Selected top motifs are shown together with interactions between them and pathways/functional categories that are enriched among the targets of these motifs. The intensity of the color corresponds to the _Z_-score of the motif, its time-dependent activity is indicated inside the node, and the thickness of each edge corresponds to its target score S pm.
Figure 4.
Mucociliary differentiation. (A) Inferred RFX motif activity profile in mucociliary differentiation of bronchial epithelial cells from three independent donors (black, red, and blue lines). (B) Key predicted regulators and their targets in this system. Selected top motifs are shown together with predicted interactions between them and pathways/functional categories that are enriched among predicted targets of these motifs. The intensity of the color corresponds to the _Z_-score of the motif, its time-dependent activity for each donor is indicated inside the node, and the thickness of the edges corresponds to the target score S pm. (C) mRNA expression profiles of the RFX2 (solid) and RFX3 (dashed) genes across the differentiation (colors of the donors as in A).
Figure 5.
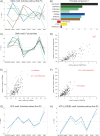
ISMARA predicts TFs involved in recruiting specific chromatin marks. (A) Activity across cell types of the SNAI1..3 motif in explaining expression (black), and levels of the chromatin marks H3K4me3 (dark green), H3K4me2 (light green), H3K9ac (dark blue), H3K27ac (light blue), and H3K36me3 (brown). (B) First principal component explaining the majority of variation in chromatin mark levels across all cell types. The bars indicate the relative contributions to the principal component of each mark. (C) Motif activities of the SNAI1..3 motif, as in A, but after removal of the first principal component. (D) _Z_-values and specificities (see text) of motifs for explaining H3K27me3 levels. The REST motif, with both highest _Z_-value and highest specificity, is indicated in red. (E) As in D, for H3K9ac levels. The two most significant motifs are shown in red. (F) As in D and E, for H3K27ac levels. (G) Activity, after removal of the first principal component, of the RFX motif for explaining H3K9ac (dark blue) and H3K27ac (light blue) levels. (H) As in G, for the ATF5_CREB motif.
Similar articles
- ARMADA: Using motif activity dynamics to infer gene regulatory networks from gene expression data.
Pemberton-Ross PJ, Pachkov M, van Nimwegen E. Pemberton-Ross PJ, et al. Methods. 2015 Sep 1;85:62-74. doi: 10.1016/j.ymeth.2015.06.024. Epub 2015 Jul 8. Methods. 2015. PMID: 26164700 - Crunch: integrated processing and modeling of ChIP-seq data in terms of regulatory motifs.
Berger S, Pachkov M, Arnold P, Omidi S, Kelley N, Salatino S, van Nimwegen E. Berger S, et al. Genome Res. 2019 Jul;29(7):1164-1177. doi: 10.1101/gr.239319.118. Epub 2019 May 28. Genome Res. 2019. PMID: 31138617 Free PMC article. - Role of chromatin and transcriptional co-regulators in mediating p63-genome interactions in keratinocytes.
Sethi I, Sinha S, Buck MJ. Sethi I, et al. BMC Genomics. 2014 Nov 29;15(1):1042. doi: 10.1186/1471-2164-15-1042. BMC Genomics. 2014. PMID: 25433490 Free PMC article. - Deciphering the genome's regulatory code: the many languages of DNA.
Rister J, Desplan C. Rister J, et al. Bioessays. 2010 May;32(5):381-4. doi: 10.1002/bies.200900197. Bioessays. 2010. PMID: 20394065 Free PMC article. Review. - Megabase replication domains along the human genome: relation to chromatin structure and genome organisation.
Audit B, Zaghloul L, Baker A, Arneodo A, Chen CL, d'Aubenton-Carafa Y, Thermes C. Audit B, et al. Subcell Biochem. 2013;61:57-80. doi: 10.1007/978-94-007-4525-4_3. Subcell Biochem. 2013. PMID: 23150246 Review.
Cited by
- Tracking of Normal and Malignant Progenitor Cell Cycle Transit in a Defined Niche.
Pineda G, Lennon KM, Delos Santos NP, Lambert-Fliszar F, Riso GL, Lazzari E, Marra MA, Morris S, Sakaue-Sawano A, Miyawaki A, Jamieson CH. Pineda G, et al. Sci Rep. 2016 Apr 4;6:23885. doi: 10.1038/srep23885. Sci Rep. 2016. PMID: 27041210 Free PMC article. - Redefining the transcriptional regulatory dynamics of classically and alternatively activated macrophages by deepCAGE transcriptomics.
Roy S, Schmeier S, Arner E, Alam T, Parihar SP, Ozturk M, Tamgue O, Kawaji H, de Hoon MJ, Itoh M, Lassmann T, Carninci P, Hayashizaki Y, Forrest AR, Bajic VB, Guler R; Fantom Consortium; Brombacher F, Suzuki H. Roy S, et al. Nucleic Acids Res. 2015 Aug 18;43(14):6969-82. doi: 10.1093/nar/gkv646. Epub 2015 Jun 27. Nucleic Acids Res. 2015. PMID: 26117544 Free PMC article. - Determinants of correlated expression of transcription factors and their target genes.
Zaborowski AB, Walther D. Zaborowski AB, et al. Nucleic Acids Res. 2020 Nov 18;48(20):11347-11369. doi: 10.1093/nar/gkaa927. Nucleic Acids Res. 2020. PMID: 33104784 Free PMC article. - Sleep-wake-driven and circadian contributions to daily rhythms in gene expression and chromatin accessibility in the murine cortex.
Hor CN, Yeung J, Jan M, Emmenegger Y, Hubbard J, Xenarios I, Naef F, Franken P. Hor CN, et al. Proc Natl Acad Sci U S A. 2019 Dec 17;116(51):25773-25783. doi: 10.1073/pnas.1910590116. Epub 2019 Nov 27. Proc Natl Acad Sci U S A. 2019. PMID: 31776259 Free PMC article. - Characterization of 3D organotypic epithelial tissues reveals tonsil-specific differences in tonic interferon signaling.
Jackson R, Rajadhyaksha EV, Loeffler RS, Flores CE, Van Doorslaer K. Jackson R, et al. bioRxiv [Preprint]. 2023 Jan 20:2023.01.19.524743. doi: 10.1101/2023.01.19.524743. bioRxiv. 2023. PMID: 36711548 Free PMC article. Updated. Preprint.
References
- Aceto N, Sausgruber N, Brinkhaus H, Gaidatzis D, Martiny-Baron G, Mazzarol G, Confalonieri S, Quarto M, Hu G, Balwierz PJ, et al. 2012. Tyrosine phosphatase SHP2 promotes breast cancer progression and maintains tumor-initiating cells via activation of key transcription factors and a positive feedback signaling loop. Nat Med 18: 529–537 - PubMed
- Arnold P, Erb I, Pachkov M, Molina N, van Nimwegen E 2012a. MotEvo: integrated Bayesian probabilistic methods for inferring regulatory sites and motifs on multiple alignments of DNA sequences. Bioinformatics 28: 487–494 - PubMed
Publication types
MeSH terms
LinkOut - more resources
Full Text Sources
Other Literature Sources
Molecular Biology Databases


