Ultrastructural characterization and three-dimensional architecture of replication sites in dengue virus-infected mosquito cells - PubMed (original) (raw)
Ultrastructural characterization and three-dimensional architecture of replication sites in dengue virus-infected mosquito cells
Jiraphan Junjhon et al. J Virol. 2014 May.
Abstract
During dengue virus infection of host cells, intracellular membranes are rearranged into distinct subcellular structures such as double-membrane vesicles, convoluted membranes, and tubular structures. Recent electron tomographic studies have provided a detailed three-dimensional architecture of the double-membrane vesicles, representing the sites of dengue virus replication, but temporal and spatial evidence linking membrane morphogenesis with viral RNA synthesis is lacking. Integrating techniques in electron tomography and molecular virology, we defined an early period in virus-infected mosquito cells during which the formation of a virus-modified membrane structure, the double-membrane vesicle, is proportional to the rate of viral RNA synthesis. Convoluted membranes were absent in dengue virus-infected C6/36 cells. Electron tomographic reconstructions elucidated a high-resolution view of the replication complexes inside vesicles and allowed us to identify distinct pathways of particle formation. Hence, our findings extend the structural details of dengue virus replication within mosquito cells and highlight their differences from mammalian cells.
Importance: Dengue virus induces several distinct intracellular membrane structures within the endoplasmic reticulum of mammalian cells. These structures, including double-membrane vesicles and convoluted membranes, are linked, respectively, with viral replication and viral protein processing. However, dengue virus cycles between two disparate animal groups with differing physiologies: mammals and mosquitoes. Using techniques in electron microscopy, we examined the differences between intracellular structures induced by dengue virus in mosquito cells. Additionally, we utilized techniques in molecular virology to temporally link events in virus replication to the formation of these dengue virus-induced membrane structures.
Figures
FIG 1
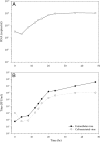
Time course of virus replication. C6/36 mosquito cells were infected with DENV at an MOI of 5. At the indicated time points infected cells were harvested. (A) Viral RNA was extracted from the cells and quantified by qRT-PCR using a DENV-specific TaqMan probe. (B) The cell-associated virus titers (open circles) in infected cell lysates or the culture supernatant of infected cells harvested at each time point were used to determine the extracellular virus titer (closed circles) using a focus immunoassay titration method.
FIG 2
DENV-induced structural rearrangements within C6/36 cells. Thin-section TEM images of dengue virus-infected resin-embedded C6/36 cells are shown. (A) DENV-infected C6/36 cells at 48 h of infection were chemically fixed with 2% paraformaldehyde and 1.5% glutaraldehyde for a minimum of 30 min at room temperature. Fixed cells were stained with 2% osmium followed by 2% aqueous uranyl acetate for 90 min. The cells were then dehydrated gradually with a series of ethanol-resin mixtures and processed for embedding with Epon 812. DENV-infected C6/36 cells showed three types of virus-induced structures: the large Vp containing Ve within and the T. The dark, small, electron-dense spheres corresponded to the morphology and size of virions (Vi). (B) DENV-infected cells were processed for high-pressure freezing and freeze-substitution in 0.5% osmium in acetone. The resin-embedded sections were stained with uranyl acetate followed by Sato's lead citrate and examined under a CM-10 transmission electron microscope (Philips). In addition to the structures observed by chemical fixation in panel A, more-detailed structures were obtained by using high-pressure freezing of cell preparations. The thread-like electron material inside the vesicles was clearly observed by this fixation method. These structures represent the RC. (C and D) Comparison of the different structures that were induced during DENV replication within C6/36 cells and Huh-7 cells. TEM micrographs of DENV-infected Huh-7 cells are shown. Infected cells were chemically fixed before processing for dehydration, infiltration, and embedding as described in Materials and Methods. The 90-nm thin sections were stained with uranyl acetate and Sato's lead citrate before examination under a CM-10 electron microscope at 80 kV. High magnification of TEM micrographs revealed CM and Ve (C) and Vp, Ve, and T (D) induced by DENV within Huh-7 cells. The CM represent morphological differences between structures induced in Huh-7 cells and C6/36 cells during DENV infection.
FIG 3
Progression of DENV-induced ultrastructure alterations. Electron micrographs representing chemically fixed DENV-infected cells at 8 h (A), 12 h (B), 16 h (C), 24 h (D), 36 h (E), and 48 h (F) after infection are shown. A minimum of 50 cells was examined for morphological changes that occur during DENV infection of C6/36 cells. An image of each representative area is shown. The Vp and Ve structures were first observed at 8 h p.i. (A). Minimal expansion in the numbers of these structures was observed at 12 p.i. (B) and 16 h p.i. (C). A significant expansion of Vp and Ve formation was observed at 24 h p.i. (D). The T were visualized only at 36 h p.i. (E), with the presence of Vp and Ve structures occupying a significant volume of infected cells. Scale bars, 200 nm.
FIG 4
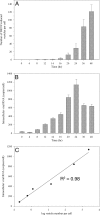
Quantitative analysis of vesicle formation during the course of DENV infection. C6/36 cells infected with DENV at 8, 12, 14, 16, 20, 24, 36, and 48 h after infection were chemically fixed and processed for TEM. Ten different cell profiles were taken randomly using a CM-10 electron microscope for measurement of Vp and Ve numbers per cell. (A) The average number of Ve per cell at each time point was plotted. The 48-h time point showed the maximum number of Ve. (B) Intracellular viral RNA content per cell. Peak RNA levels were detected at 24 h p.i. (C) The graph shows a linear correlation of log vesicle number versus total intracellular viral RNA levels. The Ve number per cell was converted to a log and subjected to linear regression analysis with total intracellular RNA copies per cell. The _r_2 and P values were 0.98 and 0.0002, respectively, and indicated the correlative multiplication of Ve formation to the viral RNA that was being produced per cell during the period of 8 to 24 h postinfection.
FIG 5
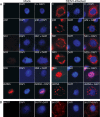
Localization of DENV proteins and newly synthesized RNA in infected cells. (A) Mock- and DENV-infected C6/36 cells at 48 h p.i. were fixed with 3.7% formaldehyde in PBS for 10 min at room temperature. The fixed cells were then permeabilized with 2% Triton X-100 in PBS for 10 min. Cells were washed 5 times with PBS before being probed with antibodies specific to DENV C protein, prM, NS1, NS3, NS5, and dsRNA. The signal was developed using a TRITC-conjugated anti-mouse secondary antibody (red, left panels). The cell nucleus was stained with DAPI (blue, middle panels). The merged images are shown in the right panels. (B) Mock- and DENV-infected cells at 12 h p.i. were treated with 10 μg/ml of actinomycin D and starved with low-glucose DMEM at 30°C for 1 h. The cells were then labeled with 10 mM BrUTP using Lipofectamine 2000. After 6 h of labeling, the cells were fixed and permeabilized as described above. Fixed cells were incubated with a anti-BrdU antibody followed by a goat anti-mouse TRITC-conjugated secondary antibody to detect newly synthesized viral RNA (red, left panels). Cell nuclei were stained with DAPI (blue, middle panels). Merged images are shown in the right panels.
FIG 6
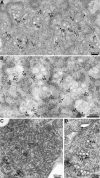
Immunoelectron microscopy of viral replication proteins and dsRNA in vesicle structures. C6/36 cells infected with DENV were high-pressure frozen at 48 h postinfection. The cells were processed for freeze-substitution, dehydration, and embedding as described in Materials and Methods. The 90-nm thick sections were placed on gold-coated grids for antibody labeling. The resin-embedded cell sections were reacted with antibodies specific to DENV proteins NS1, NS3, and NS5 and dsRNA. The specific labeling signal of the deposited small gold particles is observed in black. (A and B) Anti-NS1 (A) and anti-NS3 (B) antibodies showed labeling in the cytoplasm of infected cells, where gold particles deposited specifically to the Ve. (C and E) In contrast, anti-NS5 labeling was observed mostly in the nuclei of infected cells, while only a few gold particles was associated with the Ve. (D) Specific labeling of dsRNA was observed on the Ve. (F) The sections were stained with anti-E antibody. No labeling signal of this viral protein was detected on Ve structures. Association of viral nonstructural proteins with the Ve indicated that these structures are involved in viral RNA synthesis. N, nucleus. Black arrows depict the gold labeling signal.
FIG 7
Electron tomography of DENV-infected C6/36 cells. An overview of reconstructed tomograms of DENV-infected C6/36 cells at 48 h p.i. is shown. Infected cells were processed for high-pressure freezing and freeze-substitution in 0.5% osmium and 2% uranyl acetate. The set of tilt tomograms obtained from −60°C to 60°C with 1°C increments were collected at 300 kV. The tomograms were processed for reconstruction using the IMOD software package. Tomogram slices showed a number of Vp as double-layered membranes that enclosed Ve. The RC was clearly observed inside the Ve structures with different structural features. Electron-dense spheres smaller than virus particles decorated the Vp membrane and represented ribosomes. See Movie S1 in the supplemental material for the reconstruction tomogram and 3D rendering.
FIG 8
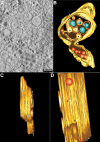
ET reveals a connection between Vp and virus particles on ER membranes. (A) Close inspection of an ET slice shows connection between Vp membrane- and ER membrane-containing virus particles. (B) A 3D surface-rendered model shows the cluster of Vp (yellow), Ve (orange), RC (blue), ribosome (light blue), and virus particles and subviral particles (red). The model depicts the connection between the Vp membrane and the membrane enclosing the virus particles. (C) A side view of the 3D model demonstrates the decoration of ribosomes on the Vp membrane. (D) An alternative side view of the 3D model shows the pores in the Vp membrane. See Movie S2 in the supplemental material for the reconstruction tomogram and 3D rendering.
FIG 9
Virus-induced vesicles contain pores open to the cytoplasm. Electron tomography of DENV-infected C6/36 cells shows Vp pores. (A) The images suggest that the neck of the Ve gives rise to the Vp pores. (B) Membrane connection of Ve pores and budding vesicles. (C and E) The 3D surface-rendered model of DENV-infected C6/36 cells. (C) Structures of Ve membrane (top orange) and budding vesicles (bottom orange) demonstrate the position of a pore and the connection between the two membranes vesicles (derived from panel B). (D) Close association of two different Vp membranes containing the Ve and virus particles. (E) The 3D model shows close association between two independent Vp membranes (yellow) that contain Ve (orange) and a virus particle (red) (derived from panel D). The RC structure (blue) is oriented in the direction of the Ve pore. See Movie S3 in the supplemental material for the reconstruction tomogram and 3D rendering.
FIG 10
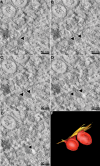
Electron tomography captures virus budding. Different Z slices of a reconstructed tomogram of DENV-infected C6/36 cells show two nascent virus particles at different stages of budding. (A to E) Different Z slices of the tomogram provide a three-dimensional perspective of these two nascent particles. Black arrows indicate the necks of the nascent particles. Scale bars represent 50 nm. (F) Three-dimensional model of budding particles shown in panels A to E. The particle on the lower left has completed budding from the ER membrane, whereas the particle on the right has a narrow neck connecting the viral and ER membranes.
Similar articles
- Composition and three-dimensional architecture of the dengue virus replication and assembly sites.
Welsch S, Miller S, Romero-Brey I, Merz A, Bleck CK, Walther P, Fuller SD, Antony C, Krijnse-Locker J, Bartenschlager R. Welsch S, et al. Cell Host Microbe. 2009 Apr 23;5(4):365-75. doi: 10.1016/j.chom.2009.03.007. Cell Host Microbe. 2009. PMID: 19380115 Free PMC article. - The transformation of enterovirus replication structures: a three-dimensional study of single- and double-membrane compartments.
Limpens RW, van der Schaar HM, Kumar D, Koster AJ, Snijder EJ, van Kuppeveld FJ, Bárcena M. Limpens RW, et al. mBio. 2011 Oct 4;2(5):e00166-11. doi: 10.1128/mBio.00166-11. Print 2011. mBio. 2011. PMID: 21972238 Free PMC article. - Ultrastructural Characterization of Turnip Mosaic Virus-Induced Cellular Rearrangements Reveals Membrane-Bound Viral Particles Accumulating in Vacuoles.
Wan J, Basu K, Mui J, Vali H, Zheng H, Laliberté JF. Wan J, et al. J Virol. 2015 Dec;89(24):12441-56. doi: 10.1128/JVI.02138-15. Epub 2015 Sep 30. J Virol. 2015. PMID: 26423955 Free PMC article. - Dengue virus- and hepatitis C virus-induced replication and assembly compartments: the enemy inside--caught in the web.
Chatel-Chaix L, Bartenschlager R. Chatel-Chaix L, et al. J Virol. 2014 Jun;88(11):5907-11. doi: 10.1128/JVI.03404-13. Epub 2014 Mar 12. J Virol. 2014. PMID: 24623440 Free PMC article. Review. - Organelle-like membrane compartmentalization of positive-strand RNA virus replication factories.
den Boon JA, Ahlquist P. den Boon JA, et al. Annu Rev Microbiol. 2010;64:241-56. doi: 10.1146/annurev.micro.112408.134012. Annu Rev Microbiol. 2010. PMID: 20825348 Review.
Cited by
- Pan-serotype dengue virus inhibitor JNJ-A07 targets NS4A-2K-NS4B interaction with NS2B/NS3 and blocks replication organelle formation.
Kiemel D, Kroell AH, Denolly S, Haselmann U, Bonfanti JF, Andres JI, Ghosh B, Geluykens P, Kaptein SJF, Wilken L, Scaturro P, Neyts J, Van Loock M, Goethals O, Bartenschlager R. Kiemel D, et al. Nat Commun. 2024 Jul 19;15(1):6080. doi: 10.1038/s41467-024-50437-3. Nat Commun. 2024. PMID: 39030239 Free PMC article. - The structure of immature tick-borne encephalitis virus supports the collapse model of flavivirus maturation.
Anastasina M, Füzik T, Domanska A, Pulkkinen LIA, Šmerdová L, Formanová PP, Straková P, Nováček J, Růžek D, Plevka P, Butcher SJ. Anastasina M, et al. Sci Adv. 2024 Jul 5;10(27):eadl1888. doi: 10.1126/sciadv.adl1888. Epub 2024 Jul 3. Sci Adv. 2024. PMID: 38959313 Free PMC article. - The Dynamic Landscape of Capsid Proteins and Viral RNA Interactions in Flavivirus Genome Packaging and Virus Assembly.
Jablunovsky A, Jose J. Jablunovsky A, et al. Pathogens. 2024 Jan 28;13(2):120. doi: 10.3390/pathogens13020120. Pathogens. 2024. PMID: 38392858 Free PMC article. Review. - Identification of a critical role for ZIKV capsid α3 in virus assembly and its genetic interaction with M protein.
Jablunovsky A, Narayanan A, Jose J. Jablunovsky A, et al. PLoS Negl Trop Dis. 2024 Jan 2;18(1):e0011873. doi: 10.1371/journal.pntd.0011873. eCollection 2024 Jan. PLoS Negl Trop Dis. 2024. PMID: 38166143 Free PMC article. - Antiviral Wolbachia strains associate with Aedes aegypti endoplasmic reticulum membranes and induce lipid droplet formation to restrict dengue virus replication.
Loterio RK, Monson EA, Templin R, de Bruyne JT, Flores HA, Mackenzie JM, Ramm G, Helbig KJ, Simmons CP, Fraser JE. Loterio RK, et al. mBio. 2024 Feb 14;15(2):e0249523. doi: 10.1128/mbio.02495-23. Epub 2023 Dec 22. mBio. 2024. PMID: 38132636 Free PMC article.
References
- Lindenbach BD, Rice CM. 2001. The viruses and their replication: Flaviviridae, p 991–1041 In Fields BN, Knipe DN, Howley PM. (ed), Fields virology, 4th ed. Lippincott-Raven, New York, NY
Publication types
MeSH terms
LinkOut - more resources
Full Text Sources
Other Literature Sources
Medical
