The yin and yang of calcium effects on synaptic vesicle endocytosis - PubMed (original) (raw)
The yin and yang of calcium effects on synaptic vesicle endocytosis
Xin-Sheng Wu et al. J Neurosci. 2014.
Abstract
A large number of studies suggest that calcium triggers and accelerates vesicle endocytosis at many synapses and non-neuronal secretory cells. However, many studies show that prolonging the duration of the stimulation train, which induces more calcium influx, slows down endocytosis; and several studies suggest that instead of triggering endocytosis, calcium actually inhibits endocytosis. Here we addressed this apparent conflict at a large nerve terminal, the calyx of Held in rat brainstem, in which recent studies suggest that transient calcium increase up to tens of micromolar concentration at the micro/nano domain triggers endocytosis. By dialyzing 0-1 μM calcium into the calyx via a whole-cell pipette, we found that slow endocytosis was inhibited by calcium dialysis in a concentration-dependent manner. Thus, prolonged, small, and global calcium increase inhibits endocytosis, whereas transient and large calcium increase at the micro/nano domain triggers endocytosis and facilitates endocytosis. This yin and yang effect of calcium may reconcile apparent conflicts regarding whether calcium accelerates or inhibits endocytosis. Whether endocytosis is fast or slow depends on the net outcome between the yin and yang effect of calcium.
Keywords: calcium; endocytosis.
Figures
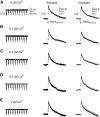
Figure 1.
Slow endocytosis at calyces being dialyzed with various concentrations of free calcium. A, Left, Sampled _I_Ca and the capacitance change (_C_m) induced by depol20ms in control (pipette solution: 0 m
m
calcium, 0.05 m
m
BAPTA in the pipette). Right, Mean _C_m change (mean + SEM, n = 12 calyces) induced by a 20 ms depolarization in control (0.05 m
m
BAPTA). B–E, Similar to A, except that the pipette contained free calcium at 0.1 μ
m
(B, n = 7), 0.2 μ
m
(C, n = 9), 0.5 μ
m
(D, n = 11), and 1 μ
m
(E, n = 12).
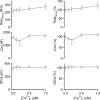
Figure 2.
Calcium dialysis into calyces inhibits slow endocytosis in a concentration-dependent manner. A, Left, The Ratedecay, Δ_C_m, and _QI_Ca induced by a 20 ms depolarization with a whole-cell pipette containing free calcium at 0 μm (0.05 m
m
BAPTA, n = 12, control), 0.1 μ
m
(n = 7), 0.2 μ
m
(n = 9), 0.5 μ
m
(n = 11), and 1 μ
m
(n = 12). Right, Same as in left, but with all data normalized to the mean of the control group (0 μ
m
free calcium). Data are expressed as mean ± SEM. **p < 0.01. B, Sampled postsynaptic recordings of the mEPSCs and bar graphs showing the mEPSC frequency differences in calyces dialyzed with 0 (n = 5 calyces) and 0.5 μ
m
(n = 5 calyces) free calcium. **p < 0.01.
Figure 3.
Rapid endocytosis in calyces being dialyzed with various concentrations of calcium. A, Left, Sampled _I_Ca and the capacitance change (_C_m) induced by depol20ms×10 in control (pipette solution: 0 m
m
calcium, 0.05 m
m
BAPTA in the pipette). Right, Mean _C_m change (mean + SEM, n = 12 calyces) induced by depol20ms×10 in control (0.05 m
m
BAPTA). B–E, Similar to A, except that the pipette contained free calcium at 0.1 μ
m
(B, n = 7), 0.2 μ
m
(C, n = 9), 0.5 μ
m
(D, n = 11), and 1 μ
m
(E, n = 12).
Figure 4.
Calcium dialysis into calyces does not inhibit rapid endocytosis. Left, The Ratedecay, Δ_C_m, and _QI_Ca induced by depol20ms×10 with a pipette containing free calcium at 0 μ
m
(0.05 m
m
BAPTA, n = 12), 0.1 μ
m
(n = 7), 0.2 μ
m
(n = 9), 0.5 μ
m
(n = 11), and 1 μ
m
(n = 12). Right, Same as in left, but with all data normalized to the mean of the control group (0 μ
m
free calcium). Data are expressed as mean ± SEM. *p < 0.05.
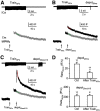
Figure 5.
An APe train causes inhibition of slow, but not rapid endocytosis. A, Sampled _I_Ca and _C_m trace (gray trace) in response to 100 APe at 20 Hz (TrainAPe). The pipette contained 0 μ
m
calcium (0.05 m
m
BAPTA, applies to A–C). The green line is the linear fit of the capacitance decay within 3–7 s after TrainAPe. B, Sampled _I_Ca and _C_m traces in response to a depol20ms applied 3 s after the TrainAPe. The red line is the linear fit of the capacitance decay within 4 s after depol20ms. The gray trace (and the green line) is the _C_m trace caused by TrainAPe alone (same as in A). The difference between the slope of the red and the green line is the Ratedecay induced by a depol20ms applied 3 s after a TrainAPe. C, Sampled _I_Ca and C_m traces in response to a depol20ms×10 applied 3 s after TrainAPe (100 APe at 20 Hz). The red line is the linear fit of the capacitance decay within 1.5 s after depol20ms×10. The gray trace (and the green line) is the C_m trace caused by TrainAPe alone (same as in A). The difference between the slope of the red and the green line is the Ratedecay induced by a depol20ms×10 applied 3 s after the TrainAPe. A–C were from the same calyx. D, Ratedecay induced by depol20ms (top) and depol20ms×10 (bottom) in control (Ctrl, no preceding APe train) and at 3 s after 100 APe train at 20 Hz (TrainAPe). The calyx numbers are labeled in the bar graph. The control data are taken from Figures 1_A and 3_A. **p < 0.01.
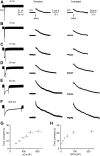
Figure 6.
Endocytosis induced by 2–200 ms depolarization. A–F, Sampled _I_Ca (left), sampled _C_m trace (middle), and averaged _C_m trace (right) induced by 2 (A, n = 9), 5 (B, n = 10), 10 (C, n = 9), 20 (D, n = 9), 50 (E, n = 8), and 200 ms (F, n = 8) depolarization from −80 to +10 mV. The scale bars in A apply to A–F. G, H, The capacitance decay (endocytosis) τ is plotted versus the Δ_C_m (G) and Q_I_Ca (H) induced by 2, 5, 10, 20, 50, and 200 ms depolarization (data taken from those shown in A–F). For 200 ms depolarization, the τ of the slow, but not the fast component is included. Data are expressed as mean ± SEM. The number of calyces for each depolarization pulse is described in A–F.
Similar articles
- Calcineurin is universally involved in vesicle endocytosis at neuronal and nonneuronal secretory cells.
Wu XS, Zhang Z, Zhao WD, Wang D, Luo F, Wu LG. Wu XS, et al. Cell Rep. 2014 May 22;7(4):982-8. doi: 10.1016/j.celrep.2014.04.020. Epub 2014 May 15. Cell Rep. 2014. PMID: 24835995 Free PMC article. - Myosin light chain kinase accelerates vesicle endocytosis at the calyx of Held synapse.
Yue HY, Xu J. Yue HY, et al. J Neurosci. 2014 Jan 1;34(1):295-304. doi: 10.1523/JNEUROSCI.3744-13.2014. J Neurosci. 2014. PMID: 24381290 Free PMC article. - Developmental shift to a mechanism of synaptic vesicle endocytosis requiring nanodomain Ca2+.
Yamashita T, Eguchi K, Saitoh N, von Gersdorff H, Takahashi T. Yamashita T, et al. Nat Neurosci. 2010 Jul;13(7):838-44. doi: 10.1038/nn.2576. Epub 2010 Jun 20. Nat Neurosci. 2010. PMID: 20562869 Free PMC article. - Ca2+-dependent regulation of synaptic vesicle endocytosis.
Yamashita T. Yamashita T. Neurosci Res. 2012 May;73(1):1-7. doi: 10.1016/j.neures.2012.02.012. Epub 2012 Mar 3. Neurosci Res. 2012. PMID: 22401840 Review. - Ca2+ Dependence of Synaptic Vesicle Endocytosis.
Leitz J, Kavalali ET. Leitz J, et al. Neuroscientist. 2016 Oct;22(5):464-76. doi: 10.1177/1073858415588265. Epub 2015 May 21. Neuroscientist. 2016. PMID: 25998187 Review.
Cited by
- Protein Kinase C and Calmodulin Serve As Calcium Sensors for Calcium-Stimulated Endocytosis at Synapses.
Jin YH, Wu XS, Shi B, Zhang Z, Guo X, Gan L, Chen Z, Wu LG. Jin YH, et al. J Neurosci. 2019 Nov 27;39(48):9478-9490. doi: 10.1523/JNEUROSCI.0182-19.2019. Epub 2019 Oct 18. J Neurosci. 2019. PMID: 31628181 Free PMC article. - Synaptic Vesicle Endocytosis in Different Model Systems.
Gan Q, Watanabe S. Gan Q, et al. Front Cell Neurosci. 2018 Jun 28;12:171. doi: 10.3389/fncel.2018.00171. eCollection 2018. Front Cell Neurosci. 2018. PMID: 30002619 Free PMC article. Review. - Altered Synaptic Membrane Retrieval after Strong Stimulation of Cerebellar Granule Neurons in Cyclic GMP-Dependent Protein Kinase II (cGKII) Knockout Mice.
Collado-Alsina A, Hofmann F, Sánchez-Prieto J, Torres M. Collado-Alsina A, et al. Int J Mol Sci. 2017 Oct 30;18(11):2281. doi: 10.3390/ijms18112281. Int J Mol Sci. 2017. PMID: 29084181 Free PMC article. - Activity and Cytosolic Na+ Regulate Synaptic Vesicle Endocytosis.
Zhu Y, Li D, Huang H. Zhu Y, et al. J Neurosci. 2020 Aug 5;40(32):6112-6120. doi: 10.1523/JNEUROSCI.0119-20.2020. Epub 2020 Jun 30. J Neurosci. 2020. PMID: 32605936 Free PMC article. - Synaptic vesicle exocytosis and increased cytosolic calcium are both necessary but not sufficient for activity-dependent bulk endocytosis.
Morton A, Marland JR, Cousin MA. Morton A, et al. J Neurochem. 2015 Aug;134(3):405-15. doi: 10.1111/jnc.13132. Epub 2015 May 14. J Neurochem. 2015. PMID: 25913068 Free PMC article.
References
Publication types
MeSH terms
Substances
LinkOut - more resources
Full Text Sources
Other Literature Sources


