Nascent chromatin capture proteomics determines chromatin dynamics during DNA replication and identifies unknown fork components - PubMed (original) (raw)
Nascent chromatin capture proteomics determines chromatin dynamics during DNA replication and identifies unknown fork components
Constance Alabert et al. Nat Cell Biol. 2014 Mar.
Abstract
To maintain genome function and stability, DNA sequence and its organization into chromatin must be duplicated during cell division. Understanding how entire chromosomes are copied remains a major challenge. Here, we use nascent chromatin capture (NCC) to profile chromatin proteome dynamics during replication in human cells. NCC relies on biotin-dUTP labelling of replicating DNA, affinity purification and quantitative proteomics. Comparing nascent chromatin with mature post-replicative chromatin, we provide association dynamics for 3,995 proteins. The replication machinery and 485 chromatin factors such as CAF-1, DNMT1 and SUV39h1 are enriched in nascent chromatin, whereas 170 factors including histone H1, DNMT3, MBD1-3 and PRC1 show delayed association. This correlates with H4K5K12diAc removal and H3K9me1 accumulation, whereas H3K27me3 and H3K9me3 remain unchanged. Finally, we combine NCC enrichment with experimentally derived chromatin probabilities to predict a function in nascent chromatin for 93 uncharacterized proteins, and identify FAM111A as a replication factor required for PCNA loading. Together, this provides an extensive resource to understand genome and epigenome maintenance.
Figures
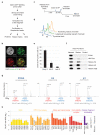
Figure 1. Isolation of replication forks and nascent chromatin by NCC technology
(a) Outline of the NCC protocol. See online methods for details. (b) Biotin-labelled newly synthesized DNA co-localizes with PCNA in replication foci. (c) Experimental design for comparison of nascent and mature chromatin. Cells released from a single thymidine block were labelled with biotin-dUTP in early-mid S-phase and harvested directly (nascent) or after 2 hours chase without biotin-dUTP (mature). (d) Cell cycle profiles representative of experimental design in c. (e) S-phase distribution of cells labelled according to the experimental design in c. Cells were scored according to their PCNA pattern. Error bars represent standard deviation (s.d.), n=4 with 300 cells counted in total. (f) NCC pull-down analysed by western blot. Control, no addition of biotin-dUTP. (g) Mass spectra showing the SILAC intensities for peptides of PCNA, H4 and H1. (h) Nascent chromatin enrichment of core replication fork components. Enrichments are given as the median, from three independent experiments, of log2 of the SILAC ratios of nascent (heavy) over mature (light) (N/M). Error bars represent standard error of the mean (s.e.m.), and indicate the precision of ratio measurements for each protein. POLE1 and histone H1 are included as a reference in all enrichment plots.
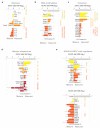
Figure 2. Genome maintenance factors at the fork
Replication-associated and replication-independent repair pathways annotated according to literature are highlighted in red and blue, respectively. Enrichments are presented as in Figure 1h.
Figure 3. Chromatin assembly and maturation
(a) Nascent chromatin enrichment of canonical and replacement histones. (b) Nascent chromatin enrichment of DNA methyl transferases, cofactors and methyl-binding proteins. (c) Nascent chromatin enrichment of the cohesin complex and regulatory factors. (d) Nascent chromatin enrichment of histone chaperones. (e) Nascent chromatin enrichment of H3K9 (top) and H3K27 (bottom) methylation writers, erasers and readers. Only core components of PRC1 and PRC2 are shown. All enrichments are presented as in Figure 1h.
Figure 4. Histone mark dynamics during chromatin maturation
(a) Histone marks analysed by western blot of NCC pull-downs of nascent and mature chromatin. 2x indicates the double amount of sample loaded in 1x. Antibody specificity was verified. (b) Histone marks in nascent chromatin replicated in the presence of cycloheximide (CHX) to prevent new histone deposition. Left, experimental design. Middle, western blot of new histone H4 acetylated at K5 in the soluble fraction prior to biotin-dUTP labelling. Right, western blot of histone marks after NCC pull-down.
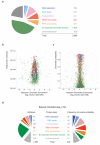
Figure 5. Identification of novel proteins with a predicted function in chromatin replication
(a) Pie-diagram illustrating the distribution of all proteins identified in NCC-SILAC into 7 functional classes (Supplementary Table 1). (b) Volcano plot showing the logarithmic ratio of protein intensities in the combined data set plotted against their median logarithmic ratio of heavy versus light peptides (nascent chromatin enrichment). (c) Plot of chromatin probability against nascent chromatin enrichment. (d) Barrel plot illustrating the distribution of proteins with a SILAC log2 ratio >0.4 before (left) and after (right) using chromatin probability to separate chromatin from non-chromatin proteins (Supplementary Table 3). Factors with a chromatin probability above 0.4 were considered chromatin, as this included roughly 90 % of the core replication factors (Fig. 1h).
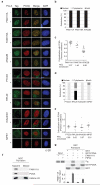
Figure 6. Localization of novel proteins with a predicted function in chromatin replication
(a) Analysis of GFP- or FLAG-tagged proteins in U-2-OS cells stably expressing RFP-PCNA. Cells were fixed directly or after pre-extraction with Triton (Pre-X). Localization pattern (b, d) and co-localization with PCNA measured by Pearson coefficient in individual nuclei were scored after direct fixation (c, e) or Pre-X (Supplementary Figure 5a, 5c and 5b, 5d). Horizontal lines represent the median. (f) Western blot of NCC pull-downs. (g) In vitro analysis of PCNA binding using GST-PCNA to pull down in vitro translated 35S-labelled FAM111A wild type (WT) or PIP box mutant (PIPmt). The diagram shows the quantification of bound FAM111A relative to input with error bars representing the s.d. (n=3).
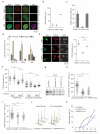
Figure 7. FAM111A facilitates PCNA loading and S phase entry
(a) Analysis of PCNA and EdU in Triton extracted U-2-OS cells. Localization patterns were quantified in transfected cells for 3 independent experiments. GFP-H2B was used as control. (b) Quantification of EdU intensities in transfected cells. The mean of 3 independent experiments with s.d. is shown, >200 cells scored per experiment. (c) Quantification of PCNA positive cells. Only transfected cells were scored. Error bars represent s.d. (n=3). The distribution of PCNA patterns is shown in Supplementary Figure 6c. (d) Cell cycle distribution based on combined analysis of MCM2 pattern and EdU incorporation in transfected cells. Supplementary Figure 6d shows representative patterns. Error bars represent s.d. (n=3), >75 cells counted per condition. (e) Analysis of total PCNA in transfected cells fixed without pre-extraction. (left) Representative images, arrowheads mark transfected cells. (right) Quantification, the mean of three independent experiments with s.d. is shown, (**) p = 0,022, (n.s.) non significant p = 0,13 (One sample t test). >200 cells scored per experiment. (f) Quantification of total and chromatin-bound PCNA in transfected cells treated or not with MG132. One representative experiment is shown. Horizontal lines represent the median, ****p < 0.0001 (unpaired t test, 77 < n). (g-k) FAM111A depletion in TIG-3 cells transfected with two independent siRNAs for 48 hours. (g) Western blot, 2x indicates the double amount of sample loaded in 1x. (*) unspecific band. Quantification of EdU incorporation (h) and chromatin-bound PCNA (i). Dot plots show EdU intensities in PCNA positive cells and PCNA intensities in EdU positive cells. Similar results were obtained in total cell populations and in U-2-OS cells (Supplementary Figure 6g-i). One representative experiment is shown. Horizontal lines represent the median, ****_p_ < 0,0001 (unpaired t test, 108 < n). (j) Cell cycle profiles of cells treated without (left) or with (right) nocodazole for 10 hours. (k) S-phase entry scored by EdU incorporation after release from quiescence by re-stimulation with serum. One representative experiment is shown, >100 cells scored per time point. Statistics source data are available in Supplementary Table 4.
Figure 8. Chromatin dynamics during DNA replication
Association dynamics of chromatin proteins during the first two hours of chromatin assembly and maturation determined by NCC-SILAC enrichment and chromatin probability (Supplementary Table 1). Selected factors are listed along with the total number of chromatin proteins identified and the functionally uncharacterized.
Similar articles
- Chromatin assembly during S phase: contributions from histone deposition, DNA replication and the cell division cycle.
Krude T, Keller C. Krude T, et al. Cell Mol Life Sci. 2001 May;58(5-6):665-72. doi: 10.1007/pl00000890. Cell Mol Life Sci. 2001. PMID: 11437228 Free PMC article. Review. - New histone supply regulates replication fork speed and PCNA unloading.
Mejlvang J, Feng Y, Alabert C, Neelsen KJ, Jasencakova Z, Zhao X, Lees M, Sandelin A, Pasero P, Lopes M, Groth A. Mejlvang J, et al. J Cell Biol. 2014 Jan 6;204(1):29-43. doi: 10.1083/jcb.201305017. Epub 2013 Dec 30. J Cell Biol. 2014. PMID: 24379417 Free PMC article. - Acute multi-level response to defective de novo chromatin assembly in S-phase.
Dreyer J, Ricci G, van den Berg J, Bhardwaj V, Funk J, Armstrong C, van Batenburg V, Sine C, VanInsberghe MA, Tjeerdsma RB, Marsman R, Mandemaker IK, di Sanzo S, Costantini J, Manzo SG, Biran A, Burny C, van Vugt MATM, Völker-Albert M, Groth A, Spencer SL, van Oudenaarden A, Mattiroli F. Dreyer J, et al. Mol Cell. 2024 Dec 19;84(24):4711-4728.e10. doi: 10.1016/j.molcel.2024.10.023. Epub 2024 Nov 12. Mol Cell. 2024. PMID: 39536749 - Chromatin remodeling factors and DNA replication.
Varga-Weisz P. Varga-Weisz P. Prog Mol Subcell Biol. 2005;38:1-30. doi: 10.1007/3-540-27310-7_1. Prog Mol Subcell Biol. 2005. PMID: 15881889 Review. - Nascent chromatin occupancy profiling reveals locus- and factor-specific chromatin maturation dynamics behind the DNA replication fork.
Gutiérrez MP, MacAlpine HK, MacAlpine DM. Gutiérrez MP, et al. Genome Res. 2019 Jul;29(7):1123-1133. doi: 10.1101/gr.243386.118. Epub 2019 Jun 19. Genome Res. 2019. PMID: 31217252 Free PMC article.
Cited by
- Replication initiation: Implications in genome integrity.
Lin YC, Prasanth SG. Lin YC, et al. DNA Repair (Amst). 2021 Jul;103:103131. doi: 10.1016/j.dnarep.2021.103131. Epub 2021 May 11. DNA Repair (Amst). 2021. PMID: 33992866 Free PMC article. Review. - aniFOUND: analysing the associated proteome and genomic landscape of the repaired nascent non-replicative chromatin.
Stefos GC, Szantai E, Konstantopoulos D, Samiotaki M, Fousteri M. Stefos GC, et al. Nucleic Acids Res. 2021 Jun 21;49(11):e64. doi: 10.1093/nar/gkab144. Nucleic Acids Res. 2021. PMID: 33693861 Free PMC article. - Kick-starting the zygotic genome: licensors, specifiers, and beyond.
Zou Z, Wang Q, Wu X, Schultz RM, Xie W. Zou Z, et al. EMBO Rep. 2024 Oct;25(10):4113-4130. doi: 10.1038/s44319-024-00223-5. Epub 2024 Aug 19. EMBO Rep. 2024. PMID: 39160344 Free PMC article. Review. - PCNA-mediated stabilization of E3 ligase RFWD3 at the replication fork is essential for DNA replication.
Lin YC, Wang Y, Hsu R, Giri S, Wopat S, Arif MK, Chakraborty A, Prasanth KV, Prasanth SG. Lin YC, et al. Proc Natl Acad Sci U S A. 2018 Dec 26;115(52):13282-13287. doi: 10.1073/pnas.1814521115. Epub 2018 Dec 10. Proc Natl Acad Sci U S A. 2018. PMID: 30530694 Free PMC article. - Genome Instability Is Promoted by the Chromatin-Binding Protein Spn1 in Saccharomyces cerevisiae.
Thurston AK, Radebaugh CA, Almeida AR, Argueso JL, Stargell LA. Thurston AK, et al. Genetics. 2018 Dec;210(4):1227-1237. doi: 10.1534/genetics.118.301600. Epub 2018 Oct 9. Genetics. 2018. PMID: 30301740 Free PMC article.
References
- Mechali M. Eukaryotic DNA replication origins: many choices for appropriate answers. Nat Rev Mol Cell Biol. 2010;11:728–738. - PubMed
- Alabert C, Groth A. Chromatin replication and epigenome maintenance. Nat Rev Mol Cell Biol. 2012;13:153–167. - PubMed
- Worcel A, Han S, Wong ML. Assembly of newly replicated chromatin. Cell. 1978;15:969–977. - PubMed
REFERENCES ONLINE METHODS
- Cox J, Mann M. MaxQuant enables high peptide identification rates, individualized p.p.b.-range mass accuracies and proteome-wide protein quantification. Nat Biotechnol. 2008;26:1367–1372. - PubMed
- Shevchenko A, Tomas H, Havlis J, Olsen JV, Mann M. In-gel digestion for mass spectrometric characterization of proteins and proteomes. Nat Protoc. 2006;1:2856–2860. - PubMed
- Rappsilber J, Ishihama Y, Mann M. Stop and go extraction tips for matrixassisted laser desorption/ionization, nanoelectrospray, and LC/MS sample pretreatment in proteomics. Anal Chem. 2003;75:663–670. - PubMed
- Marzluff WF, Gongidi P, Woods KR, Jin J, Maltais LJ. The human and mouse replication-dependent histone genes. Genomics. 2002;80:487–498. - PubMed
Publication types
MeSH terms
Substances
Grants and funding
- 084229/WT_/Wellcome Trust/United Kingdom
- 103139/Z/13/Z/WT_/Wellcome Trust/United Kingdom
- 092076/WT_/Wellcome Trust/United Kingdom
- 077707/WT_/Wellcome Trust/United Kingdom
- 281765/ERC_/European Research Council/International
- 091020/WT_/Wellcome Trust/United Kingdom
LinkOut - more resources
Full Text Sources
Other Literature Sources
Molecular Biology Databases
Research Materials
Miscellaneous
