MarvelD3 couples tight junctions to the MEKK1-JNK pathway to regulate cell behavior and survival - PubMed (original) (raw)
. 2014 Mar 3;204(5):821-38.
doi: 10.1083/jcb.201304115. Epub 2014 Feb 24.
Ahmed Elbediwy, Barbara Vacca, Sébastien Dupasquier, Sandra A Hemkemeyer, Tesha Suddason, Ana C Costa, Jean-Bernard Beaudry, Ceniz Zihni, Ewen Gallagher, Christophe E Pierreux, Maria S Balda, Karl Matter
Affiliations
- PMID: 24567356
- PMCID: PMC3941049
- DOI: 10.1083/jcb.201304115
MarvelD3 couples tight junctions to the MEKK1-JNK pathway to regulate cell behavior and survival
Emily Steed et al. J Cell Biol. 2014.
Abstract
MarvelD3 is a transmembrane component of tight junctions, but there is little evidence for a direct involvement in the junctional permeability barrier. Tight junctions also regulate signaling mechanisms that guide cell proliferation; however, the transmembrane components that link the junction to such signaling pathways are not well understood. In this paper, we show that MarvelD3 is a dynamic junctional regulator of the MEKK1-c-Jun NH2-terminal kinase (JNK) pathway. Loss of MarvelD3 expression in differentiating Caco-2 cells resulted in increased cell migration and proliferation, whereas reexpression in a metastatic tumor cell line inhibited migration, proliferation, and in vivo tumor formation. Expression levels of MarvelD3 inversely correlated with JNK activity, as MarvelD3 recruited MEKK1 to junctions, leading to down-regulation of JNK phosphorylation and inhibition of JNK-regulated transcriptional mechanisms. Interplay between MarvelD3 internalization and JNK activation tuned activation of MEKK1 during osmotic stress, leading to junction dissociation and cell death in MarvelD3-depleted cells. MarvelD3 thus couples tight junctions to the MEKK1-JNK pathway to regulate cell behavior and survival.
Figures
Figure 1.
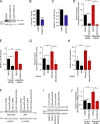
MarvelD3 regulates cell migration and proliferation in Caco-2 cells. (A–E) Caco-2 cells were transfected with siRNAs, and total cell extracts were analyzed by immunoblotting (A), or cells were assayed for migration or proliferation (B–E). B shows phase-contrast images, and D shows a maximal intensity projection of migrating cells labeled for tight and adherens junction proteins. The yellow lines label the wound edges at time 0. (C) Migration in to the cell-free space was measured after 26 h and normalized to controls. Shown are means ± 1 SD; n = 3. (E) Proliferation was analyzed by measuring the increase in cell numbers and normalizing the numbers to control cultures. Shown are means ± 1 SD; n = 3. (F–H) A complementation assay to test the specificity of MarvelD3 siRNAs was performed by repeating the assays as described in B–E using a Caco-2 cell line expressing mouse MarvelD3 (M-MD3) with a C-terminal VSV tag. G and H show means ± 1 SD; n = 6. *, P < 0.05; **, P < 0.01. Bars: (B) 100 µm; (D) 20 µm.
Figure 2.
MarvelD3 regulates cell migration and proliferation of MiaPaca-2 cells. (A and B) Immunoblotting of extracts of cell lines derived from breast and pancreas (A) and prostate (B). (C) RT-PCR analysis of MarvelD3 isoform expression in healthy adult pancreas, and control and MarvelD3 isoform 1–transfected MiaPaca-2 cells. (D) Immunoblotting of control and MarvelD3 isoform 1–transfected MiaPaca-2 cells. (E) Morphology of control and MarvelD3-expressing MiaPaca-2 cells (two clones, C2 and C8, were analyzed in all experiments) was assessed by phase-contrast and immunofluorescence microscopy (see
Fig. S2
for analysis of other junctional markers). (F and G) Migration assays were performed with GFP- and RFP-expressing pools of control and MarvelD3-expressing MiaPaca-2 cells over 2 d. The quantification was performed, and images were taken after 24 h and show means ± 1 SD; n = 3. Note, only control cells freely mix after they have filled the gap or when labeled cells are co-cultured (see Fig. S2 C for co-cultures). (H) Proliferation of control and MarvelD3-expressing cells was analyzed by measuring cell numbers after 3 d (shown are means ± 1 SD; n = 3). (I and J) Nude mice were injected with control or MarvelD3-expressing MiaPaca-2 cells, and tumor formation was assessed by measuring the size over 47 d. Shown are means ± 1 SD of five animals per cell line. *, P < 0.05; **, P < 0.01. Bars: (E, top) 50 µm; (E, bottom) 20 µm; (F) 100 µm.
Figure 3.
MarvelD3 regulates JNK signaling and cyclin D1 expression. (A and B) Control and MarvelD3-expressing MiaPaca-2 cells were analyzed by immunoblotting of whole-cell lysates to monitor phosphorylation of MAPKs. B shows a quantification of the ratios between phosphorylated and nonphosphorylated forms. (C and D) Caco-2 cells transfected with control and MarvelD3-targeting siRNAs were analyzed for MAPK activation as described in A and B. (E and F) Analysis of AP1 promoter activity using a dual-luciferase reporter assay in Caco-2 (E) and MiaPaca-2 (F) cells. Control cells were cotransfected with an empty expression vector, and the other cells were cotransfected as indicated with cDNAs encoding MarvelD3 isoforms or Occludin. (G) Immunoblot of Caco-2 cells transfected as in E using antibodies against MarvelD3 and Occludin. (H) Activities of the indicated promoters were analyzed as in E and F. (I–K) Analysis of cyclin D1 expression was analyzed by reporter gene assay in control and MarvelD3-targeting siRNA-transfected Caco-2 cells or by immunoblotting in MiaPaca-2 and Caco-2 cells after transfection or depletion of MarvelD3 (J and K). All graphs show means ± 1 SD; n = 3. *, P < 0.05; **, P < 0.01; ***, P < 0.001.
Figure 4.
JNK signaling and regulation of proliferation and migration. (A) MiaPaca-2 cells were incubated with 20 and 50 µM SP600125, and JNK inhibition was then analyzed by blotting for phosphorylated c-Jun. All subsequent experiments were performed with 20 µm SP600125. (B–E) Migration and proliferation of MiaPaca-2 (B and C) and siRNA-transfected Caco-2 cells (D and E) were analyzed as in Fig. 1. No increase in cell death was observed when similarly treated cells were analyzed by DNA staining (Fig. 9). (F–H) Caco-2 cells were transfected with control and MarvelD3- and JNK1/2-targeting siRNAs as indicated. After 3 d, the cells were analyzed by immunoblotting (F), for cell migration (G), or cell proliferation (H). (I and J) Control and MarvelD3 siRNA–transfected Caco-2 cells were incubated with DMSO or SP600125 for 10 h before lysis and analysis by immunoblotting. J shows a quantification of cyclin D1 expression. All graphs show means ± 1 SD; n = 3 (B and C), n = 5 (G), n = 6 (H), and n = 4 (K). *, P < 0.05; **, P < 0.01; ***, P < 0.001.
Figure 5.
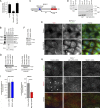
MarvelD3 regulates MEKK1 localization. (A) AP1 reporter gene assays were performed with MarvelD3 constructs consisting of the N-terminal domain only (MarvelD3_NTD) or lacking this domain (MarvelD3_1ΔNTD). Shown are means ± 1 SD; n = 3. (B) GST pull-down assays were performed using Caco-2 cell extracts and fusion proteins containing either the N-terminal domain (GST-MarvelD3_NTD) or either one of the two isoform C-terminal domains (GST-MarvelD3_CTD1 and GST-MarvelD3_CTD2). The precipitates were then analyzed by immunoblotting as indicated. (C) Schematic of MEKK1. Indicated are the RING finger and the kinase domains as well as the regions contained by the fusion proteins used for the recombinant protein-binding assay in D. IR, intervening region. (D). His6-tagged MEKK1 fusion proteins were incubated with GST-MarvelD3_NTD fusion protein bound to glutathione beads. After washing, bound fusion proteins were eluted analyzed by immunoblotting using antibodies against His6 and GST. (E) Control and MarvelD3-expressing MiaPaca-2 cells were stained for the VSV-tagged transfected protein and MEKK1. Arrowheads point to cell–cell contacts positive for MEKK1. (F and G) Immunoblotting of Caco-2 cells transfected with siRNAs as indicated. (H and I) Caco-2 cells transfected with the indicated siRNAs were stained with mouse anti-MEKK1 and rabbit anti-MarvelD3 antibodies. Arrowheads point to junctional fragments positive for MEKK1. Graphs in I show ratios of mean densities of junctional segments and cytoplasm (shown are means ± 1 SD; n = 10). Bars: (E) 20 µm; (H) 10 µm. ***, P < 0.001.
Figure 6.
MarvelD3 and MEKK1 form complexes. (A and B) MDCK cell lines expressing MarvelD3 fusion proteins carrying the biotin ligase at the C terminus (A) or the N terminus (B) were incubated with biotin for 24 h as indicated before fixation and staining with fluorescently labeled streptavidin and anti-HA (A) or anti-Myc antibodies. The white lines demark the border between cells that do and do not express the fusion protein. (C) Immunoblotting of extracts of cells expressing the MarvelD3 biotin ligase fusion proteins. (D) Cell extracts of the cell lines shown in A and B were incubated with streptavidin beads, and the resulting precipitates were blotted with the indicated antibodies. (E) Caco-2 cells transiently transfected as indicated were analyzed as described in D. Bars, 10 µm.
Figure 7.
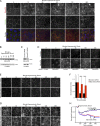
MarvelD3 is required for epithelial monolayer integrity during osmotic stress. (A and B) Caco-2 cells were osmotically stressed for the times indicated before analysis by immunofluorescence (A) or immunoblotting (B). The insets in A show twofold magnifications of the MarvelD3 staining. (C–H) Cells were transfected with control and MarvelD3 targeting siRNAs and were then osmotically stressed. The cells were then analyzed by immunoblotting (C), immunofluorescence (D–G), or by measuring electrical impedance (H). Cells were stained for Occludin and MarvelD3 (D), ZO-1 (E), or F-actin (G). For a quantification of Occludin and MarvelD3 localization and comparison with endocytic markers, see
Fig. S3
. F shows a quantification of the area covered by individual cells to assess cell contraction. Shown are means ± 1 SD of three experiments counting 20–40 cells per condition and experiment; ***, P < 0.001. Bars: (A, D, and E) 10 µm; (G) 20 µm.
Figure 8.
MarvelD3 and the MEKK1–JNK pathway during osmotic stress. (A–J) Caco-2 cells were transfected with control and MarvelD3 siRNAs and were then osmotically stressed for the times indicated before analysis by immunoblotting (A–C and F–J), staining for phospho-Jnk (p-JNK; D) or with mouse anti-MEKK1 antibodies (E). Arrowheads in E mark cell–cell contacts positive for MEKK1. The graphs in C, G, and J show individual determinations, and the lines were drawn through the corresponding means for each time point. See
Fig. S4
for specificity controls for the MEKK1 staining and quantification of junction-associated MEKK1. Bars: (D) 20 µm; (E) 10 µm.
Figure 9.
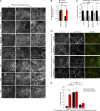
MarvelD3 depletion induces apoptosis during osmotic stress. (A–E) Caco-2 cells were transfected with siRNAs and then osmotically stressed as indicated. The cells were then either labeled by nuclear staining (A and B), for determination of caspase 3/7 activation (C), or using a TUNEL assay (D and E). B shows a quantification of nuclear fragmentation as an indication of apoptotic cells. C shows a quantification of caspase 3/7 induction. E shows cells fluorescently labeled in the TUNEL assay. All graphs show means ± 1 SD; n = 3 (B), n = 5 (C), and n = 8 (E). *, P < 0.05; **, P < 0.01; ***, P < 0.001. Bars, 20 µm.
Figure 10.
Regulation of MarvelD3 internalization by JNK. (A and B) Caco-2 cells were preincubated with the indicated inhibitors before a 15-min osmotic shock under the same condition. The cells were then fixed and stained for MarvelD3. B shows a quantification of junction-associated MarvelD3 fluorescence; provided are means ± 1 SD; n = 8. Note, only the JNK inhibitor SP600125 prevents MarvelD3 internalization. (C) Cell contraction was assessed as described in Fig. 6 F. Shown are means ± 1 SD of three experiments counting 20–40 cells per condition and experiment. (D) Cells were preincubated with the JNK inhibitor SP600125 or DMSO (control) and then osmotically stressed under the same conditions for 8 h before fixation and staining for the junctional markers ZO-1 and p120Catenin. (E) Cells transfected with the indicated siRNAs were hyperosmotically shocked for 8 h. The JNK inhibitor SP600125 was added either together with the hypertonic medium or 15 min after shock induction. Apoptosis was then assessed with a TUNEL assay. Shown are means ± 1 SD; n = 7. **, P < 0.01; ***, P < 0.001. Bars, 10 µm.
Similar articles
- Identification of MarvelD3 as a tight junction-associated transmembrane protein of the occludin family.
Steed E, Rodrigues NT, Balda MS, Matter K. Steed E, et al. BMC Cell Biol. 2009 Dec 22;10:95. doi: 10.1186/1471-2121-10-95. BMC Cell Biol. 2009. PMID: 20028514 Free PMC article. - Spatio-temporal expression pattern and role of the tight junction protein MarvelD3 in pancreas development and function.
Heymans C, Delcorte O, Spourquet C, Villacorte-Tabelin M, Dupasquier S, Achouri Y, Mahibullah S, Lemoine P, Balda MS, Matter K, Pierreux CE. Heymans C, et al. Sci Rep. 2021 Jul 15;11(1):14519. doi: 10.1038/s41598-021-93654-2. Sci Rep. 2021. PMID: 34267243 Free PMC article. - Downregulation of tight junction-associated MARVEL protein marvelD3 during epithelial-mesenchymal transition in human pancreatic cancer cells.
Kojima T, Takasawa A, Kyuno D, Ito T, Yamaguchi H, Hirata K, Tsujiwaki M, Murata M, Tanaka S, Sawada N. Kojima T, et al. Exp Cell Res. 2011 Oct 1;317(16):2288-98. doi: 10.1016/j.yexcr.2011.06.020. Epub 2011 Jul 8. Exp Cell Res. 2011. PMID: 21763689 - JSAP1, a novel jun N-terminal protein kinase (JNK)-binding protein that functions as a Scaffold factor in the JNK signaling pathway.
Ito M, Yoshioka K, Akechi M, Yamashita S, Takamatsu N, Sugiyama K, Hibi M, Nakabeppu Y, Shiba T, Yamamoto KI. Ito M, et al. Mol Cell Biol. 1999 Nov;19(11):7539-48. doi: 10.1128/MCB.19.11.7539. Mol Cell Biol. 1999. PMID: 10523642 Free PMC article. - A look at tricellulin and its role in tight junction formation and maintenance.
Mariano C, Sasaki H, Brites D, Brito MA. Mariano C, et al. Eur J Cell Biol. 2011 Oct;90(10):787-96. doi: 10.1016/j.ejcb.2011.06.005. Epub 2011 Aug 24. Eur J Cell Biol. 2011. PMID: 21868126 Review.
Cited by
- ARHGEF18/p114RhoGEF Coordinates PKA/CREB Signaling and Actomyosin Remodeling to Promote Trophoblast Cell-Cell Fusion During Placenta Morphogenesis.
Beal R, Alonso-Carriazo Fernandez A, Grammatopoulos DK, Matter K, Balda MS. Beal R, et al. Front Cell Dev Biol. 2021 Mar 25;9:658006. doi: 10.3389/fcell.2021.658006. eCollection 2021. Front Cell Dev Biol. 2021. PMID: 33842485 Free PMC article. - A cryptic tubulin-binding domain links MEKK1 to curved tubulin protomers.
Filipčík P, Latham SL, Cadell AL, Day CL, Croucher DR, Mace PD. Filipčík P, et al. Proc Natl Acad Sci U S A. 2020 Sep 1;117(35):21308-21318. doi: 10.1073/pnas.2006429117. Epub 2020 Aug 17. Proc Natl Acad Sci U S A. 2020. PMID: 32817551 Free PMC article. - Role of tight junction-associated MARVEL protein marvelD3 in migration and epithelial-mesenchymal transition of hepatocellular carcinoma.
Li Y, Li T, Zhou D, Wei J, Li Z, Li X, Jia S, Ouyang Q, Qi S, Chen Z, Zhang B, Yu J, Jia J, Xu A, Huang J. Li Y, et al. Cell Adh Migr. 2021 Dec;15(1):249-260. doi: 10.1080/19336918.2021.1958441. Cell Adh Migr. 2021. PMID: 34338154 Free PMC article. - Probing nuclear pore complex architecture with proximity-dependent biotinylation.
Kim DI, Birendra KC, Zhu W, Motamedchaboki K, Doye V, Roux KJ. Kim DI, et al. Proc Natl Acad Sci U S A. 2014 Jun 17;111(24):E2453-61. doi: 10.1073/pnas.1406459111. Epub 2014 Jun 3. Proc Natl Acad Sci U S A. 2014. PMID: 24927568 Free PMC article. - Host genetics and gut microbiota synergistically regulate feed utilization in egg-type chickens.
Zhang W, Lan F, Zhou Q, Gu S, Li X, Wen C, Yang N, Sun C. Zhang W, et al. J Anim Sci Biotechnol. 2024 Sep 9;15(1):123. doi: 10.1186/s40104-024-01076-7. J Anim Sci Biotechnol. 2024. PMID: 39245742 Free PMC article.
References
- Antonetti D.A., Barber A.J., Khin S., Lieth E., Tarbell J.M., Gardner T.W., and Penn State Retina Research Group 1998. Vascular permeability in experimental diabetes is associated with reduced endothelial occludin content: vascular endothelial growth factor decreases occludin in retinal endothelial cells. Diabetes. 47:1953–1959 10.2337/diabetes.47.12.1953 - DOI - PubMed
- Antonetti D.A., Barber A.J., Hollinger L.A., Wolpert E.B., Gardner T.W. 1999. Vascular endothelial growth factor induces rapid phosphorylation of tight junction proteins occludin and zonula occluden 1. A potential mechanism for vascular permeability in diabetic retinopathy and tumors. J. Biol. Chem. 274:23463–23467 10.1074/jbc.274.33.23463 - DOI - PubMed
- Balda M.S., Whitney J.A., Flores C., González S., Cereijido M., Matter K. 1996. Functional dissociation of paracellular permeability and transepithelial electrical resistance and disruption of the apical-basolateral intramembrane diffusion barrier by expression of a mutant tight junction membrane protein. J. Cell Biol. 134:1031–1049 10.1083/jcb.134.4.1031 - DOI - PMC - PubMed
Publication types
MeSH terms
Substances
LinkOut - more resources
Full Text Sources
Other Literature Sources
Molecular Biology Databases
Research Materials
Miscellaneous


