Structural basis for the prion-like MAVS filaments in antiviral innate immunity - PubMed (original) (raw)
Structural basis for the prion-like MAVS filaments in antiviral innate immunity
Hui Xu et al. Elife. 2014.
Erratum in
- Correction: Structural basis for the prion-like MAVS filaments in antiviral innate immunity.
Xu H, He X, Zheng H, Huang LJ, Hou F, Yu Z, de la Cruz MJ, Borkowski B, Zhang X, Chen ZJ, Jiang QX. Xu H, et al. Elife. 2015 Aug 28;4:e07546. doi: 10.7554/eLife.07546. Elife. 2015. PMID: 26314863 Free PMC article. No abstract available.
Abstract
Mitochondrial antiviral signaling (MAVS) protein is required for innate immune responses against RNA viruses. In virus-infected cells MAVS forms prion-like aggregates to activate antiviral signaling cascades, but the underlying structural mechanism is unknown. Here we report cryo-electron microscopic structures of the helical filaments formed by both the N-terminal caspase activation and recruitment domain (CARD) of MAVS and a truncated MAVS lacking part of the proline-rich region and the C-terminal transmembrane domain. Both structures are left-handed three-stranded helical filaments, revealing specific interfaces between individual CARD subunits that are dictated by electrostatic interactions between neighboring strands and hydrophobic interactions within each strand. Point mutations at multiple locations of these two interfaces impaired filament formation and antiviral signaling. Super-resolution imaging of virus-infected cells revealed rod-shaped MAVS clusters on mitochondria. These results elucidate the structural mechanism of MAVS polymerization, and explain how an α-helical domain uses distinct chemical interactions to form self-perpetuating filaments. DOI: http://dx.doi.org/10.7554/eLife.01489.001\.
Keywords: MAVS; cryoEM reconstruction; innate immunity; prion-like filaments; three-stranded filaments.
Conflict of interest statement
ZJC: Reviewing editor, eLife.
The other authors declare that no competing interests exist.
Figures
Figure 1.. CryoEM reconstruction of MAVS CARD filaments.
(A) Diagrams of the domain organization in MAVS and deletion mutants used in this study. (B) Flag-MAVS CARD purified from HEK293T cells analyzed by silver stained SDS-PAGE and cryoEM imaging. The cryoEM image is displayed in reversed contrast (protein in black) for better visualization. (C) Left: a side view of the final 3D reconstruction of MAVS CARD filament. The X-ray crystal structure model of the human MAVS CARD (PDB: 2VGQ) was docked into the cryoEM map. Three strands are colored differently. Right: the rod-like densities at the periphery of the cryoEM density map allowed positioning of H1, H4, H3 and H6 without modification (top; see Video 2). When a front part of the density map was sectioned off with a clipping plane (red mesh), the H1 helix (blue) fitted into a rod-like density very well (bottom). (D) Pseudoatomic model of MAVS CARD filament. Dashed lines indicate the inter- (red) and intra-strand (yellow) interaction interfaces. DOI:
http://dx.doi.org/10.7554/eLife.01489.003
Figure 1—figure supplement 1.. Processing of cryoEM images of the MAVS CARD filaments.
(A) Left, summed power spectrum from a set of horizontally centered particles; right, summed power spectrum from 360 projections of the final cryoEM map of MAVS CARD filament. To better exhibit the weak signal within the resolution range of 16.8 to 8.2 Å (red circle), the power spectrum from the cryoEM map (right side) was presented after the application of a square root function. The red arrows point to the four characteristic layer lines that were seen in the raw data (left panel). (B) The first 12 Eigen images after the multivariate statistical analysis of the boxed segments from individual MAVS CARD filaments. (C and D) Convergence of the two helical symmetry parameters: the azimuthal rotation (ΔΦ in C) and the axial rise (Δz in D). In the middle of the refinement, changes in axial rise were manually imposed twice to check the robustness of the convergence. (E) The Fourier shell correlation (FSC) between two 3D reconstructions that were calculated independently from the top and bottom halves of the dataset (‘Materials and methods’). The estimated resolution at FSC = 0.5 is 9.6 Å. (F) Representative class averages of MAVS CARD filaments after multivariate statistical analysis and hierarchical classification. (G) When the four-start helical symmetry (n=4; −4 was the mirrored symmetry) was used in the IHRSR, the refinement did not converge to the correct axial rise (17.1 instead of 16.7 Å as in 1A). Full refinements with n=−4 led to maps with densities averaged out, and no features corresponding to the secondary structures showed up either. DOI:
http://dx.doi.org/10.7554/eLife.01489.004
Figure 1—figure supplement 2.. Structural model of MAVS CARD filaments and its chirality determination by cryo electron tomography (cryo-ET).
(A) A cross-eye stereo view of the cryoEM map of the MAVS CARD filament with multiple copies of the MAVS CARD X-ray models (PDB: 2VGQ) docked in position, showing the left-handed three-stranded helix. Colored arrows mark the three strands. (B) The projection image calculated from a 2.7 nm slice out of the cryo-ET reconstruction as viewed from the outer surface of the filaments. Yellow arrows point to portions of multiple filaments where apparent helical stripes were resolved. Three zoomed views from filaments of different orientations display a well-matched left-handedness and groove dimension with the cryo-EM map. The measured distance spanning four stripes (∼7 layers) is ∼118 angstroms and the measured angle between the helical strips and the helical axis is ∼50°, both consistent with the cryoEM map. DOI:
http://dx.doi.org/10.7554/eLife.01489.005
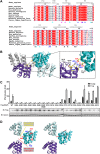
Figure 2.. Charged residues are conserved at the inter-strand interface of MAVS CARD filament.
(A) Sequence alignment of the MAVS CARD from 10 different species with the secondary structures based on the X-ray model of human MAVS CARD. The alignment was generated with ClustalW (
http://www.ebi.ac.uk/clustalw/
) and formatted using ESPript (
http://espript.ibcp.fr/ESPript/ESPript/
). The colored arrowheads mark the residues mutated in this study:
pink
, key negatively charged residues at the inter-strand interface;
blue
, key positively charged residues at the inter-strand interface;
cyan
, key residues at the intra-strand interface;
black
, residues showing normal activity when substituted with alanine. (B) MAVS CARD hexamer model with key residues at the inter-strand interface between two subunits (purple and cyan) shown as yellow sticks. The inset on the right side is an expanded view of these residues. The side chains of these residues (D23, E26, R37, R64 and R65) in the model were optimized by testing different rotamers in Coot. (C) Effects of mutating the residues at the inter-strand interface and other conserved charged residues on MAVS activity. Wild-type MAVS and CARD mutants at different positions were transiently expressed in HEK293T-IFNβ-luciferase reporter cells. Cells were lysed 24 hr later, and the MAVS signaling was tested by luciferase reporter assay in a dose-dependent manner. Western blot was done to monitor the expression level of the transfected MAVS proteins with α-tubulin as loading controls. (D) A stereo view of MAVS CARD model with the surface-exposed, conserved charged residues shown as sticks (blue, positively charged residues; red, negatively charged residues). Mutations of these surface residues, which are not involved in the inter-strand interactions, do not impair MAVS signaling. DOI:
http://dx.doi.org/10.7554/eLife.01489.008
Figure 2—figure supplement 1.. Mutations at the inter-strand interface disrupt MAVS CARD polymerization.
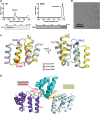
(A) Size-exclusion chromatography of recombinant wild-type human MAVS CARD and the E26R mutant. Aliquots of the fractions were analyzed by silver staining (left) or Coomassie blue staining (right). Wild-type MAVS CARD eluted at the void volume (∼0.8 ml), while the soluble mutant E26R eluted at ∼1.9 ml. (B) Negative-stained EM images of human MAVS CARD E26R. No filaments were observed. Scale bar, 100 nm. (C) Superimposition of the crystal structure of wild-type human MAVS CARD (PDB: 2VGQ, yellow) with those of the horse MAVS CARD E26R (PDB: 4O9L, magenta) and R64C mutants (PDB: 4O9F, blue). The Cα atoms of E26R and R64C in the crystal structures are shown in sphere representations (red and blue, respectively). (D) Mapping of the important residues for MAVS polymerization obtained from solubility screen to the crystal structure. Most of them are located at the two interfaces of the MAVS CARD filament. DOI:
http://dx.doi.org/10.7554/eLife.01489.009
Figure 3.. The intra-strand interface is mediated by hydrophobic interactions and hydrogen bonding.
(A) MAVS CARD hexamer model with interacting residues at the intra-strand interface shown as yellow sticks. Residues that showed normal activity when substituted with alanine are displayed in brown. (B) MAVS proteins with point mutations at the intra-strand interface were tested for IFNβ induction and protein expression as in Figure 2C. DOI:
http://dx.doi.org/10.7554/eLife.01489.011
Figure 4.. CARD filament is the organization center of the MAVS Filament.
(A) Segments from negative-stain EM images of (1) Flag-MAVS CARD and (2) MAVSΔProTM and those from cryoEM images of (3) Flag-MAVS CARD and (4) MAVSΔProTM. For better visualization, protein is black in the cryoEM images. Yellow arrows point to the extra mass that made the MAVSΔProTM filaments larger in diameter. (B) Side and top views of the cryoEM reconstruction of MAVSΔProTM filament (gray, surface), which has the same helical symmetry as the MAVS CARD filament (purple, mesh). Only the middle 90 Å portion of the MAVSΔProTM map is shown. (C) Side and top views of the full MAVSΔProTM map (gray, surface) whose threshold was set at a proper level to overlap well with the CARD-only map (purple, mesh). A cylindrical sheet of extra density appeared at ∼15 Å away from the central CARD filament. (D) Schematic view of the helical packing of MAVSΔProTM with the sequences C-terminal to the CARD shown as dashed coils. DOI:
http://dx.doi.org/10.7554/eLife.01489.012
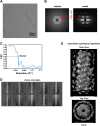
Figure 4—figure supplement 1.. Image processing for the MAVSΔProTM filaments.
(A) A typical cryoEM image of MAVSΔProTM filaments (protein is black). Scale bar, 100 nm. (B) Summed power spectrum of boxed segments of MAVSΔProTM filaments after central alignment along X-axis (left) is compared with the modulus image (square root of power spectrum) of the averaged power spectrum calculated from 360 projections of the final 3D map (right). Similar to Figure 1–figure supplement 1A, the square root function enhanced the signal to noise ratio for the resolution range beyond 16.8 Å. The red arrows point to the characteristic layer lines seen in the power spectrum of the raw data. (C) Fourier Shell Correlation (FSC) between two independently calculated maps from two halves of the data. The estimated resolution is 16.4 Å at FSC = 0.5. (D) 10 class averages after 5-round hierarchical classification of the dataset. Outside the central CARD filament density, there were clear densities at the neighboring region (red arrow heads), which were probably contributed by the intervening segment between the CARD and the TM domain. (E) Two views of the 3D map of MAVSΔProTM before symmetry imposition. The helical symmetry is relatively robust, and the extra density surrounding the CARD filament is fairly strong (bottom panel). The scale bars in both panels = 12 nm. DOI:
http://dx.doi.org/10.7554/eLife.01489.013
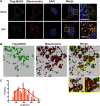
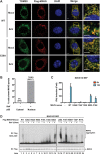
Figure 5.. In virus-infected cells MAVS redistributes and forms rod-shaped puncta on the surface of mitochondria.
(A) _Mavs_−/− MEF cells stably expressing Flag-tagged wild-type MAVS were mock-treated or infected with Sendai virus (SeV) for 12 hr and stained with MitoTracker (Mitochondria; red) and anti-Flag antibody (Flag-MAVS; green). Redistribution of MAVS among mitochondria was examined using SR-SIM. Expanded views of the areas within the yellow windows in the merged images were shown on the right. The SeV-infected cells contain bright foci of Flag-MAVS. The white arrowheads in the rightmost image of the bottom row highlight a few bright rod-shaped MAVS clusters. Scale bars, 5.0 μm. (B) 3D reconstruction of MAVS clusters (green) on the surface of mitochondria (red). Scale bar, 1.0 μm. The areas within the yellow windows in the merged image (right most) were expanded to show a few clusters that appear to bridge between mitochondrial membranes. (C) Histogram and Gaussian fit (black curve) of the length distribution that was measured from the SIM images of individual MAVS clusters as in panel A (SeV; N = 74) in virus-infected cells. DOI:
http://dx.doi.org/10.7554/eLife.01489.014
Figure 5—figure supplement 1.. Mutations at the inter-strand interface that disrupt CARD polymerization abolish the SeV-induced redistribution of MAVS on mitochondria.
_Mavs_−/− MEF cells stably expressing Flag-tagged wild-type MAVS or its mutants were mock-treated or infected with SeV for 12 hr and stained with MitoTracker (Mitochondrial matrix; red), anti-Flag antibody (Flag-MAVS; green), anti-p65 antibody (grey) and DAPI (blue). MAVS redistribution was examined using confocal microscopy. Areas within the yellow windows in the merged images are expanded and shown in the rightmost images. MAVS puncta are highlighted by white arrowheads. WT and E80A MAVS showed strong puncta formation and clear p65 nuclear translocation, whereas E26A, a mutation at the inter-strand interface, did not. E80A is a conserved charged residue as a control. Scale bar, 5.0 μm. DOI:
http://dx.doi.org/10.7554/eLife.01489.015
Figure 5—figure supplement 2.. Mutations at the intra-strand interface that disrupt CARD polymerization abolish the SeV-induced redistribution of MAVS on mitochondria.
Similar to the Figure 5—figure supplement 1, mutations of two important residues (F16 and Y30) at the intra-strand interface were tested in a similar fashion. Scale bar, 5.0 μm. DOI:
http://dx.doi.org/10.7554/eLife.01489.016
Figure 5—figure supplement 3.. Strong correlations among MAVS puncta formation, MAVS signaling and MAVS CARD polymerization.
Mavs −/− MEF cells stably expressing Flag-tagged wild-type MAVS or its mutants were mock-treated or infected with SeV for 12 hr. (A) As in Figure 5—figure supplement 1, MAVS puncta formation and redistribution were examined using confocal microscopy. Mitochondria were stained by TOM20 antibody (mitochondrial outer membrane). Areas within the yellow windows in the merged images are expanded and shown in the rightmost images. MAVS puncta are highlighted by white arrowheads. Scale bars, 5.0 μm. (B) Statistical analysis of the correlation between nuclear translocation of p65 and SeV-induced MAVS puncta formation in _Mavs_−/− MEF cells expressing wild-type MAVS. No p65 nuclear translocation was seen in uninfected cells. Among cells showing clear p65 translocation, only those showing large MAVS puncta (probably > 0.4 μm) were classified as positive. Even with such strict constraints, more than 70% of the cells were positive. (C) IFNβ production was rescued by expressing MAVS wild-type and mutants (E80A and F16H) that retain the capability of forming MAVS puncta, but not those (E26A, F16A and Y30A) that failed to form puncta (Figure 5—figure supplement 1). The IFNβ mRNA level was quantified by q-RT-PCR. (D) MAVS proteins in the mitochondrial extracts from different cells were separated by SDD-AGE (top) or SDS-PAGE (bottom) followed by western blotting. Cells expressing wild-type MAVS and mutants (E80A, L48A, F16H, W56Y, Y30F and R77A) that rescued IFNβ production gave rise to strong aggregate signal in the SDD-AGE assay, whereas those expressing MAVS mutants defective in forming puncta or inducing IFNβ (E26A, R64A, R65A, F16A or Y30A) did not form aggregates. Y30A showed slightly higher basal aggregation signal, independent of viral infection. DOI:
http://dx.doi.org/10.7554/eLife.01489.017
Figure 6.. A working model for MAVS activation by RIG-I/RNA complexes.
Detection of 5’-pppRNA by RIG-I or dsRNA by MDA5 or RIG-I triggers the formation of RIG-I (or MDA5)/RNA/polyUb complex. The CARD domains of individual complexes are poised properly to attract three MAVS CARD domains and support the nucleation of the filament. In the resting state, MAVS CARD is sequestered and has a low probability of forming polymers. The RIG-I (or MDA5)/RNA/polyUb complexes stabilize the MAVS CARDs in the exposed state and bring three copies together to initiate the filament formation. Once started, a short MAVS CARD filament promotes its own elongation by attracting more MAVS CARDs into the assembly. The filament can form on the surface of one mitochondrion or between two or more mitochondrial membranes. Inset, one or more mitochondria might be involved in MAVS filament formation. DOI:
http://dx.doi.org/10.7554/eLife.01489.018
Comment in
- Three-stranded antiviral attack.
Patel JR, García-Sastre A. Patel JR, et al. Elife. 2014 Jan 1;3:e02369. doi: 10.7554/eLife.02369. Elife. 2014. PMID: 24596154 Free PMC article.
Similar articles
- Three-stranded antiviral attack.
Patel JR, García-Sastre A. Patel JR, et al. Elife. 2014 Jan 1;3:e02369. doi: 10.7554/eLife.02369. Elife. 2014. PMID: 24596154 Free PMC article. - Solid-state NMR resonance assignments of the filament-forming CARD domain of the innate immunity signaling protein MAVS.
He L, Lührs T, Ritter C. He L, et al. Biomol NMR Assign. 2015 Oct;9(2):223-7. doi: 10.1007/s12104-014-9579-6. Epub 2014 Oct 10. Biomol NMR Assign. 2015. PMID: 25301530 - Structural Insights into mitochondrial antiviral signaling protein (MAVS)-tumor necrosis factor receptor-associated factor 6 (TRAF6) signaling.
Shi Z, Zhang Z, Zhang Z, Wang Y, Li C, Wang X, He F, Sun L, Jiao S, Shi W, Zhou Z. Shi Z, et al. J Biol Chem. 2015 Oct 30;290(44):26811-20. doi: 10.1074/jbc.M115.666578. Epub 2015 Sep 18. J Biol Chem. 2015. PMID: 26385923 Free PMC article. - Mechanisms of MAVS regulation at the mitochondrial membrane.
Jacobs JL, Coyne CB. Jacobs JL, et al. J Mol Biol. 2013 Dec 13;425(24):5009-19. doi: 10.1016/j.jmb.2013.10.007. Epub 2013 Oct 9. J Mol Biol. 2013. PMID: 24120683 Free PMC article. Review. - MAVS Coordination of Antiviral Innate Immunity.
Vazquez C, Horner SM. Vazquez C, et al. J Virol. 2015 Jul;89(14):6974-7. doi: 10.1128/JVI.01918-14. Epub 2015 May 6. J Virol. 2015. PMID: 25948741 Free PMC article. Review.
Cited by
- The mitochondrial ubiquitin ligase MARCH5 resolves MAVS aggregates during antiviral signalling.
Yoo YS, Park YY, Kim JH, Cho H, Kim SH, Lee HS, Kim TH, Sun Kim Y, Lee Y, Kim CJ, Jung JU, Lee JS, Cho H. Yoo YS, et al. Nat Commun. 2015 Aug 6;6:7910. doi: 10.1038/ncomms8910. Nat Commun. 2015. PMID: 26246171 Free PMC article. - Structural basis for host membrane remodeling induced by protein 2B of hepatitis A virus.
Vives-Adrián L, Garriga D, Buxaderas M, Fraga J, Pereira PJ, Macedo-Ribeiro S, Verdaguer N. Vives-Adrián L, et al. J Virol. 2015 Apr;89(7):3648-58. doi: 10.1128/JVI.02881-14. Epub 2015 Jan 14. J Virol. 2015. PMID: 25589659 Free PMC article. - Virus subtype-specific suppression of MAVS aggregation and activation by PB1-F2 protein of influenza A (H7N9) virus.
Cheung PH, Lee TT, Kew C, Chen H, Yuen KY, Chan CP, Jin DY. Cheung PH, et al. PLoS Pathog. 2020 Jun 8;16(6):e1008611. doi: 10.1371/journal.ppat.1008611. eCollection 2020 Jun. PLoS Pathog. 2020. PMID: 32511263 Free PMC article. - SMOCs: supramolecular organizing centres that control innate immunity.
Kagan JC, Magupalli VG, Wu H. Kagan JC, et al. Nat Rev Immunol. 2014 Dec;14(12):821-6. doi: 10.1038/nri3757. Epub 2014 Oct 31. Nat Rev Immunol. 2014. PMID: 25359439 Free PMC article. Review. - Reactive oxygen species induce virus-independent MAVS oligomerization in systemic lupus erythematosus.
Buskiewicz IA, Montgomery T, Yasewicz EC, Huber SA, Murphy MP, Hartley RC, Kelly R, Crow MK, Perl A, Budd RC, Koenig A. Buskiewicz IA, et al. Sci Signal. 2016 Nov 29;9(456):ra115. doi: 10.1126/scisignal.aaf1933. Sci Signal. 2016. PMID: 27899525 Free PMC article.
References
- Adams PD, Grosse-Kunstleve RW, Hung LW, Ioerger TR, McCoy AJ, Moriarty NW, Read RJ, Sacchettini JC, Sauter NK, Terwilliger TC. 2002. PHENIX: building new software for automated crystallographic structure determination. Acta Crystallographica Section D Biological Crystallography 58:1948–1954. 10.1107/S0907444902016657 - DOI - PubMed
Publication types
MeSH terms
Substances
Grants and funding
- R01 HL089966/HL/NHLBI NIH HHS/United States
- R01 GM093271/GM/NIGMS NIH HHS/United States
- R01 GM088197/GM/NIGMS NIH HHS/United States
- R01 AI093967/AI/NIAID NIH HHS/United States
- R01 GM088745/GM/NIGMS NIH HHS/United States
- 1S10RR027972/RR/NCRR NIH HHS/United States
- C06RR30414/RR/NCRR NIH HHS/United States
- R01GM093271/GM/NIGMS NIH HHS/United States
- S10 RR027972/RR/NCRR NIH HHS/United States
- P30 CA142543/CA/NCI NIH HHS/United States
- R01GM088197/GM/NIGMS NIH HHS/United States
- C06 RR030414/RR/NCRR NIH HHS/United States
LinkOut - more resources
Full Text Sources
Other Literature Sources
Molecular Biology Databases
Miscellaneous


