Phorbol ester modulates interleukin 6- and interleukin 1-regulated expression of acute phase plasma proteins in hepatoma cells - PubMed (original) (raw)
. 1988 Nov 25;263(33):17390-6.
Affiliations
- PMID: 2460462
- PMCID: PMC4729383
Phorbol ester modulates interleukin 6- and interleukin 1-regulated expression of acute phase plasma proteins in hepatoma cells
H Baumann et al. J Biol Chem. 1988.
Abstract
Interleukin 6 (IL 6) and interleukin 1 (IL-1) regulate the expression of acute phase plasma proteins in rat and human hepatoma cells. Phorbol ester, 12-O-tetradecanoylphorbol-13-acetate (TPA), partially mimics the stimulatory effect of IL-6 but reduces that effect of IL-1. TPA and IL-6 act synergistically. These regulatory properties of TPA are also manifested in HepG2 cells transiently transfected with an indicator gene construct carrying the IL-1/IL-6 regulatory enhancer element of the rat alpha 1-acid glycoprotein gene. IL-6 and IL-1 act independently of TPA-inducible kinase C, and of changes in intracellular Ca2+ concentrations. However, prolonged pretreatment of HepG2 cells with TPA results in a drastically reduced cytokine response that is proportional to the loss of cell surface binding activity for the cytokine. These data suggest that hormones activating protein kinase C probably play a contributing role in stimulating the expression of acute phase plasma protein genes but they may be crucial in controlling the responsiveness of liver cells to inflammatory cytokines during subsequent stages of the hepatic acute phase reaction.
Figures
Fig. 1. Effect of TPA and IL-6 on H-35
H-35 cells were treated for 8 h with serum-free MEM containing 1 _μ_M dexamethasone alone or with 0.1 _μ_M TPA and/or 250 units/ml IL-6. Aliquots of cellular RNA (15 _μ_g) were analyzed by Northern blot hybridization for the levels of _α_-fibrinogen (_α_-FB), _γ_-fibrinogen (_γ_-FB), thiostatin (TST), and AGP. The autoradiograms were exposed for 24 h. The ethidium bromide (EtBr)-stained RNA pattern of the _α_-fibrinogen analysis is pictured to demonstrate equal loading of RNA.
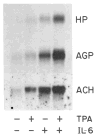
Fig. 2. Effect of TPA and IL-6 on HepG2 cells
HepG2 cells were treated for 8 h with MEM containing 0.1 _μ_M dexamethasone alone or with 0.15 _μ_M TPA and/or 100 units/ml IL-6. Cellular RNA (15 _μ_g) were analyzed by Northern blot hybridization for haptoglobin (HP), AGP, and _α_1-antichymotrypsin (ACH) mRNA. Autoradiogram of the mature RNA bands are shown after 3-day (HP, AGP) and 1-day (ACH) exposures.
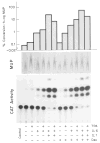
Fig. 3. Regulated expression of a rat AGP-CAT gene construct in HepG2 cells
HepG2 cells in 6-well cluster plates were transfected with plasmid DNA mixture (18 μ_g of pAGP(3xDRE)-140-CAT and 1 μg of pIE-MUP/ml). After a recovery period of 24 h and culture in serum-free MEM for 16 h, the cells were treated for 8 h with MEM containing the indicated factors (0.15 μM TPA, 100 units/ml IL-6, 250 units/ml IL-1_α; 0.1 _μ_M dexamethasone (Dex)). The thin layer chromatography pattern of the chloramphenicol acetyltransferase (CAT) activity in 10 _μ_l of cell extract after 20 h autoradiography is reproduced. The rocket immunoelectrophoresis of the MUP secreted by the same cells during the final 24 h period is shown at the top. The specific chloramphenicol acetyltransferase activity was determined by using 0.3–30 _μ_l of the cell extract and the values were related to the amount of MUP produced.
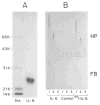
Fig. 4. Gel electrophoretic pattern and activity of 125I-IL-6
In A, an aliquot of IL-6 labeled with the 125I-Bolton Hunger reagent (65,000 cpm) was separated together with molecular weight standard (Std) on an 11% sodium dodecyl sulfate polyacrylamide gel. The fluorogram shown was exposed for 3 h. (The 125I-IL-6 protein band at _M_r 24,000 yielded 59,800 cpm.) In B, medium (MEM, 1% fetal calf serum, 1 μM dexamethasone) containing 10, 1, or 0.1 ng/ml of unlabeled IL-6 or 125I-IL-6 (lanes 1, 2, and 3, respectively), was tested on HepG2 cells. The stimulated production of haptoglobin (HP) and fibrinogen (FB) was measured by rocket Immunoelectrophoresis (20). Control represents HepG2 cells treated with medium containing the buffer used for chromatography of 125I-IL-6 (50 mM sodium phosphate, pH 7.5, 0.25% gelatin; Ref. 41). The amount of buffer added was the same as used in the experimental assays.
Fig. 5. Binding of IL-1 and IL-6 to HepG2 cells
Confluent monolayers of HepG2 cells were pretreated for 24 h with serum-free MEM alone (○), or with MEM containing either 0.1 _μ_M dexamethasone (△), 0.15 _μ_M TPA (●), or dexamethasone and TPA (▲). The cells were washed once with binding buffer and then incubated for 4 h at 4 °C with increasing concentrations of 125I IL-1 or 125I-IL-6. The binding of label to the 4 cm2 (IL-1) or 10 cm2 (IL-6) monolayer cultures was expressed according to Scatchard (55). The mean values of duplicate cultures are shown.
Similar articles
- NF-AB, a liver-specific and cytokine-inducible nuclear factor that interacts with the interleukin-1 response element of the rat alpha 1-acid glycoprotein gene.
Won KA, Baumann H. Won KA, et al. Mol Cell Biol. 1991 Jun;11(6):3001-8. doi: 10.1128/mcb.11.6.3001-3008.1991. Mol Cell Biol. 1991. PMID: 1645444 Free PMC article. - Recombinant interleukin 6 regulates the transcriptional activation of a set of human acute phase genes.
Morrone G, Ciliberto G, Oliviero S, Arcone R, Dente L, Content J, Cortese R. Morrone G, et al. J Biol Chem. 1988 Sep 5;263(25):12554-8. J Biol Chem. 1988. PMID: 2457587 - PKCalpha mediated induction of miR-101 in human hepatoma HepG2 cells.
Chiang CW, Huang Y, Leong KW, Chen LC, Chen HC, Chen SJ, Chou CK. Chiang CW, et al. J Biomed Sci. 2010 May 6;17(1):35. doi: 10.1186/1423-0127-17-35. J Biomed Sci. 2010. PMID: 20444294 Free PMC article.
Cited by
- Structure, hormonal regulation, and identification of the interleukin-6- and dexamethasone-responsive element of the rat haptoglobin gene.
Marinković S, Baumann H. Marinković S, et al. Mol Cell Biol. 1990 Apr;10(4):1573-83. doi: 10.1128/mcb.10.4.1573-1583.1990. Mol Cell Biol. 1990. PMID: 2320005 Free PMC article. - Stimulation of CRP secretion in HepG2 cells: cooperative effect of dexamethasone and interleukin 6.
Depraetere S, Willems J, Joniau M. Depraetere S, et al. Agents Actions. 1991 Nov;34(3-4):369-75. doi: 10.1007/BF01988730. Agents Actions. 1991. PMID: 1667244 - IL-1beta and IL-6 modulate apolipoprotein E gene expression in rat hepatocyte primary culture.
Ribeiro A, Mangeney M, Bernard I, Chambaz J, Delers F. Ribeiro A, et al. Mediators Inflamm. 1992;1(5):329-33. doi: 10.1155/S0962935192000498. Mediators Inflamm. 1992. PMID: 18475480 Free PMC article. - Distinct regulation of the interleukin-1 and interleukin-6 response elements of the rat haptoglobin gene in rat and human hepatoma cells.
Baumann H, Morella KK, Jahreis GP, Marinković S. Baumann H, et al. Mol Cell Biol. 1990 Nov;10(11):5967-76. doi: 10.1128/mcb.10.11.5967-5976.1990. Mol Cell Biol. 1990. PMID: 2172789 Free PMC article.
References
- Koj A. In: Structure and Function of Plasma Proteins. Allison AC, editor. Vol. 1. Plenum Publishing Corp; New York: 1974. pp. 73–125.
- Kushner I. Ann N Y Acad Sci. 1982;389:39–48. - PubMed
- Koj A. In: The Acute-phase Response to Injury and Infection. Gordon AH, Koj A, editors. Elsevier Scientific Publishing Co; Amsterdam: 1985. pp. 145–151.
- Kampschmidt RF. J Reticuloendothel Soc. 1978;23:287–297. - PubMed
- Selinger MJ, McAdam KPWJ, Kaplan MM, Sipe JD, Vogel SN, Rosenstreich DL. Nature. 1980;285:498–500. - PubMed
Publication types
MeSH terms
Substances
LinkOut - more resources
Full Text Sources
Other Literature Sources
Medical
Miscellaneous


