PRDM9 binding organizes hotspot nucleosomes and limits Holliday junction migration - PubMed (original) (raw)
PRDM9 binding organizes hotspot nucleosomes and limits Holliday junction migration
Christopher L Baker et al. Genome Res. 2014 May.
Abstract
In mammals, genetic recombination during meiosis is limited to a set of 1- to 2-kb regions termed hotspots. Their locations are predominantly determined by the zinc finger protein PRDM9, which binds to DNA in hotspots and subsequently uses its SET domain to locally trimethylate histone H3 at lysine 4 (H3K4me3). This sets the stage for double-strand break (DSB) formation and reciprocal exchange of DNA between chromatids, forming Holliday junctions. Here we report genome-wide analyses of PRDM9-dependent histone modifications using two inbred mouse strains differing only in their PRDM9 zinc finger domain. We show that PRDM9 binding actively reorganizes nucleosomes into a symmetrical pattern, creating an extended nucleosome-depleted region. These regions are centered by a consensus PRDM9 binding motif, whose location and identity was confirmed in vitro. We also show that DSBs are centered over the PRDM9 binding motif within the nucleosome-depleted region. Combining these results with data from genetic crosses, we find that crossing-over is restricted to the region marked by H3K4me3. We suggest that PRDM9-modified nucleosomes create a permissible environment that first directs the location of DSBs and then defines the boundaries of Holliday junction branch migration.
Figures
Figure 1.
H3K4me3 ChIP-seq allows detection of PRDM9-dependent sites using co-isogenic strains of mice. (A) PRDM9Dom2 and PRDM9Cst differ both in the number of zinc finger domains and sequence-specific identity of individual domains. The known domain structure of PRDM9 includes an N-terminal KRAB domain (Krüppel-associated box), an SSXRD (SSX repression domain), a PR/SET domain (methyltransferase activity), an invariant zinc finger domain, and a C-terminal zinc finger array. The three most polymorphic positions in the individual zinc finger domains are indicated by their amino acid identity. (B) H3K4me3 coverage profile from a representative 100-kb window of chromosome 1. H3K4me3 peaks can be unique or shared between the two strains of mice (in all figures, the Prdm9 Cst allele originates from the CAST/EiJ strain and is represented in red, while Prdm9 Dom2, the endogenous allele for C57BL/6J, is represented in blue). (C) Venn diagram showing quantity and identity of H3K4me3 peaks. Prdm9 Cst results in more unique H3K4me3-marked hotspots. (D) H3K4me3 signal for strain-specific peaks. Prdm9 Cst hotspots have higher methylation levels than Prdm9 Dom2 in the B6 background (red: Prdm9Cst; blue: Prdm9Dom2).
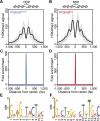
Figure 2.
H3K4me3 nucleosomes are organized symmetrically around predicted PRDM9 binding motifs, creating a central nucleosome-depleted region (NDR). (A) Aggregate plot of H3K4me3 signal across a 2-kb window from PRDM9Dom2-dependent hotspots (n = 7235 peaks; black line: mean; gray shading: SD). Predicted nucleosome positions are shown above. (B) Similar to A except for PRDM9Cst-dependent hotspots (n = 9306 peaks). (C) Fold enrichment of the PRDM9Dom2 motif over the PRDM9Cst motif at Prdm9Dom2-dependent hotspots in A. (D) Fold enrichment of the PRDM9Cst motif over the PRDM9Dom2 motif at PRDM9Cst-dependent hotspots in (B). (E) The PRDM9Dom2 motif identified in the NDRs of H3K4me3 peaks in A. (F) The PRDM9Cst motif.
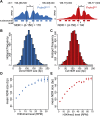
Figure 3.
NDR length is dependent on H3K4me3 level. (A) Two examples of calculating the NDR at individual hotspots, one activated by each Prdm9 allele (red: Prdm9 Cst; blue: Prdm9 Dom2). Hotspot nucleosome positions are indicated below the coverage profile with filled bars and PRDM9 binding motif positions in black. The NDR length was determined by subtracting 150 from the distance (d) between the centers of the −1 and +1 nucleosomes. (B) Distribution of NDR sizes for Prdm9 Dom2 hotspots (n = 5538). (C) Distribution of NDR sizes for Prdm9 Cst hotspots (n = 9194). (D) Relationship between H3K4me3 level and NDR length at Prdm9 Dom2 hotspots (error bars: standard error of the mean NDR length for each H3K4me3 category). (E) Relationship between NDR length and H3K4me3 level at Prdm9 Cst hotspots.
Figure 4.
PRDM9 binds hotspots at the NDR. (A) Mapping of a PRDM9Dom2 binding site. EMSA shows specific binding of PRDM9Dom2 at the PRDM9Dom2_-_activated hotspot located on chromosome 19 at Mb 59.51. Only unlabeled DNA oligo 2, containing the consensus motif, can compete for binding (Lane 5). All lanes contain labeled DNA; otherwise, the composition of the binding reactions is shown above the blot (B: PRDM9Dom2; C: PRDM9Cst). (B) ChIP-seq coverage profile from Prdm9 Dom2 showing H3K4me3 nucleosome positions, the NDR, and DNA sequences used for the EMSA in A (red bars indicate DNA that binds PRDM9Dom2; black bars indicate nonbinding sequences; yellow bars show the position of the PRDM9Dom2 motif; green squares under the graph show the position of the predicted binding site from Getun et al. [2012]). (C) The partial DNA sequence of oligo 2. Nucleotides matching the PRDM9Dom2 consensus motif in Figure 2E are formatted to indicate similarity. (D–F) Similar to A–C except showing results for PRDM9Cst. (D) PRDM9Cst binds hotspot chr1 171.36 Mb at the NDR ([NC] Noncompeting oligo 2 from chr19 59.51 in panel A. [_Hlx1_] Binding site for Hlx1 [chr1 186.44 Mb] from Billings et al. [2013]). (E) ChIP-seq coverage profile at hotspot chr1 171.37 from B6-Prdm9CAST-KI. (F) Partial DNA sequence of oligo 3 indicating nucleotides that match the consensus in Figure 2F.
Figure 5.
Nucleosome positions at hotspots are variable prior to PRDM9 binding. (A) Schematic of an idealized PRDM9-modified hotspot showing signal intensity representing nucleosome positions. Primers for qPCR were designed to amplify DNA from either the −1 or +1 nucleosomes flanking the NDR (peak) or from within the NDR (valley). (B) Ratio of nucleosome peak vs. nucleosome-depleted valley signal in two genetic backgrounds. qPCR was performed on MNase-digested spermatocyte chromatin DNA from both strains (blue: DNA from Prdm9 Dom2; red: Prdm9 Cst). Error bars represent standard deviation of triplicate measurements from three biological replicates. (**) P < 0.01, (***) P < 0.001; one-sided _t_-test. Hotspots Pbx1 and chr1 88.114 Mb are PRDM9Dom2-activated; hotspot Hlx1 is PRDM9Cst-activated. (C) Aggregation plot showing nucleosome positions at hotspots inferred from MNase-seq of C57BL/6J spermatocytes. Only hotspots containing a motif that is predicted to be recognized by the endogenous Prdm9 allele show organized nucleosomes (blue: aggregation of Prdm9 Dom2 sites; red: Prdm9 Cst sites). (D) Aggregation plot of Prdm9 Dom2 and Prdm9 Cst hotspots from sequencing of mononucleosome DNA prepared from B6-Prdm9CAST-KI spermatocytes.
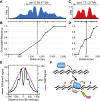
Figure 6.
Location of meiotic crossing-over is constrained by PRDM9-dependent chromatin modification. (A) ChIP-seq coverage profile for the PRDM9Dom2-activated hotspot at chr11 89.47 Mb showing nucleosome peaks and central NDR. The black line underneath the nucleosome profile indicates the positions of SNPs (circles) between the B6 and CAST strains used to map recombination and the PRDM9Dom2 binding site from Supplemental Figure S5 (black box). (B) Cumulative frequency of recombination in B6 × CAST F1 progeny plotted against the scaled distance across the H3K4me3 signal track (n = 56 recombinant mice). (C,D) Similar to A and B except for the PRDM9Cst-activated hotspot at chr1 171.37 Mb. (C) ChIP-seq coverage profile showing nucleosome peaks and central NDR. SNPs assayed for recombination between B6 and CAST strains are indicated below as circles and PRDM9Cst binding site from Figure 4F is shown (black box). (D) Cumulative frequency of recombination at this hotspot (n = 13). (E) Aggregation plot of Prdm9 Dom2 hotspots for mean H3K4me3 signal (black line) and mean DMC1 ChIP-seq signal representing the position of meiotic DSBs (purple line, n = 7235 peaks, DSB data from Brick et al. [2012]). (F) Model of PRDM9 activation of hotspots. Prior to PRDM9 binding, hotspot nucleosome positions can be variable. Upon binding, PRDM9 modifies surrounding nucleosomes (red circles), which are remodeled to create a central nucleosome-depleted region (NDR). Later, DNA double-strand breaks (DSBs) are introduced at the NDR.
Similar articles
- The Meiotic Recombination Activator PRDM9 Trimethylates Both H3K36 and H3K4 at Recombination Hotspots In Vivo.
Powers NR, Parvanov ED, Baker CL, Walker M, Petkov PM, Paigen K. Powers NR, et al. PLoS Genet. 2016 Jun 30;12(6):e1006146. doi: 10.1371/journal.pgen.1006146. eCollection 2016 Jun. PLoS Genet. 2016. PMID: 27362481 Free PMC article. - PRDM9 Methyltransferase Activity Is Essential for Meiotic DNA Double-Strand Break Formation at Its Binding Sites.
Diagouraga B, Clément JAJ, Duret L, Kadlec J, de Massy B, Baudat F. Diagouraga B, et al. Mol Cell. 2018 Mar 1;69(5):853-865.e6. doi: 10.1016/j.molcel.2018.01.033. Epub 2018 Feb 22. Mol Cell. 2018. PMID: 29478809 - PRDM9 and Its Role in Genetic Recombination.
Paigen K, Petkov PM. Paigen K, et al. Trends Genet. 2018 Apr;34(4):291-300. doi: 10.1016/j.tig.2017.12.017. Epub 2018 Jan 21. Trends Genet. 2018. PMID: 29366606 Free PMC article. Review. - Mouse PRDM9 DNA-binding specificity determines sites of histone H3 lysine 4 trimethylation for initiation of meiotic recombination.
Grey C, Barthès P, Chauveau-Le Friec G, Langa F, Baudat F, de Massy B. Grey C, et al. PLoS Biol. 2011 Oct;9(10):e1001176. doi: 10.1371/journal.pbio.1001176. Epub 2011 Oct 18. PLoS Biol. 2011. PMID: 22028627 Free PMC article. - The consequences of sequence erosion in the evolution of recombination hotspots.
Tiemann-Boege I, Schwarz T, Striedner Y, Heissl A. Tiemann-Boege I, et al. Philos Trans R Soc Lond B Biol Sci. 2017 Dec 19;372(1736):20160462. doi: 10.1098/rstb.2016.0462. Philos Trans R Soc Lond B Biol Sci. 2017. PMID: 29109225 Free PMC article. Review.
Cited by
- Whole-exome sequencing of a rare case of familial childhood acute lymphoblastic leukemia reveals putative predisposing mutations in Fanconi anemia genes.
Spinella JF, Healy J, Saillour V, Richer C, Cassart P, Ouimet M, Sinnett D. Spinella JF, et al. BMC Cancer. 2015 Jul 23;15:539. doi: 10.1186/s12885-015-1549-6. BMC Cancer. 2015. PMID: 26201965 Free PMC article. - The Landscape of Mouse Meiotic Double-Strand Break Formation, Processing, and Repair.
Lange J, Yamada S, Tischfield SE, Pan J, Kim S, Zhu X, Socci ND, Jasin M, Keeney S. Lange J, et al. Cell. 2016 Oct 20;167(3):695-708.e16. doi: 10.1016/j.cell.2016.09.035. Epub 2016 Oct 13. Cell. 2016. PMID: 27745971 Free PMC article. - Prdm9 Intersubspecific Interactions in Hybrid Male Sterility of House Mouse.
Mukaj A, Piálek J, Fotopulosova V, Morgan AP, Odenthal-Hesse L, Parvanov ED, Forejt J. Mukaj A, et al. Mol Biol Evol. 2020 Dec 16;37(12):3423-3438. doi: 10.1093/molbev/msaa167. Mol Biol Evol. 2020. PMID: 32642764 Free PMC article. - Hotspots for Initiation of Meiotic Recombination.
Tock AJ, Henderson IR. Tock AJ, et al. Front Genet. 2018 Nov 5;9:521. doi: 10.3389/fgene.2018.00521. eCollection 2018. Front Genet. 2018. PMID: 30467513 Free PMC article. Review. - Differential effects of two catalytic mutations on full-length PRDM9 and its isolated PR/SET domain reveal a case of pseudomodularity.
Powers NR, Billings T, Paigen K, Petkov PM. Powers NR, et al. Genetics. 2021 Dec 10;219(4):iyab172. doi: 10.1093/genetics/iyab172. Genetics. 2021. PMID: 34747456 Free PMC article.
References
- Acquaviva L, Szekvolgyi L, Dichtl B, Dichtl BS, de La Roche Saint Andre C, Nicolas A, Geli V 2013. The COMPASS subunit Spp1 links histone methylation to initiation of meiotic recombination. Science 339: 215–218 - PubMed
Publication types
MeSH terms
Substances
Grants and funding
- P01 GM099640/GM/NIGMS NIH HHS/United States
- R01 GM078452/GM/NIGMS NIH HHS/United States
- R01 GM078643/GM/NIGMS NIH HHS/United States
- P30 CA034196/CA/NCI NIH HHS/United States
- CA34196/CA/NCI NIH HHS/United States
- P50 GM076468/GM/NIGMS NIH HHS/United States
- T32 HD007065-32/HD/NICHD NIH HHS/United States
- T32 HD007065/HD/NICHD NIH HHS/United States
- F32 GM101736/GM/NIGMS NIH HHS/United States
LinkOut - more resources
Full Text Sources
Other Literature Sources
Molecular Biology Databases


