Genome-wide quantitative analysis of DNA methylation from bisulfite sequencing data - PubMed (original) (raw)
Genome-wide quantitative analysis of DNA methylation from bisulfite sequencing data
Kemal Akman et al. Bioinformatics. 2014.
Abstract
Here we present the open-source R/Bioconductor software package BEAT (BS-Seq Epimutation Analysis Toolkit). It implements all bioinformatics steps required for the quantitative high-resolution analysis of DNA methylation patterns from bisulfite sequencing data, including the detection of regional epimutation events, i.e. loss or gain of DNA methylation at CG positions relative to a reference. Using a binomial mixture model, the BEAT package aggregates methylation counts per genomic position, thereby compensating for low coverage, incomplete conversion and sequencing errors.
Availability and implementation: BEAT is freely available as part of Bioconductor at www.bioconductor.org/packages/devel/bioc/html/BEAT.html. The package is distributed under the GNU Lesser General Public License 3.0.
© The Author 2014. Published by Oxford University Press. All rights reserved. For Permissions, please e-mail: journals.permissions@oup.com.
Figures
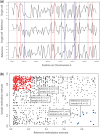
Fig. 1.
(a) Methylation estimates and epimutation calls on a DNA segment. For all regions with sufficient read coverage, the black curves show the methylation estimates for a single cell sample (top), a reference sample (bottom) and their difference (middle). Regions with methylating epimutations are marked in red, while regions with demethylating epimutations are marked in blue. Samples used for our analysis in this article were obtained from neuronal cells of young mice (data unpublished). (b) Scatterplot of methylation estimates of a multi-cell reference sample (x-axis) versus those of a sample (y-axis) for all common regions with sufficient coverage. Each dot represents a single region that is covered by both samples. Red dots indicate methylating epimutations in the sample, while blue dots indicate demethylating epimutations in the sample. Four dots representing exemplary regions with epimutations at the corresponding boundary value ranges for demethylating and methylating epimutations have been annotated with their values of methylated (k) and total (n) counts. Note that there exists no boundary line separating the red and the blue region because our Bayesian model assigns different methylation estimates to tuples (k1, n1), (k2, n2) with equal empirical methylation level k1/n1 = k2/n2
Similar articles
- Estimation of the methylation pattern distribution from deep sequencing data.
Lin P, Forêt S, Wilson SR, Burden CJ. Lin P, et al. BMC Bioinformatics. 2015 May 6;16:145. doi: 10.1186/s12859-015-0600-6. BMC Bioinformatics. 2015. PMID: 25943746 Free PMC article. - Approaches for the Analysis and Interpretation of Whole-Genome Bisulfite Sequencing Data.
Stuart T, Buckberry S, Nguyen TV, Lister R. Stuart T, et al. Methods Mol Biol. 2024;2842:391-403. doi: 10.1007/978-1-0716-4051-7_20. Methods Mol Biol. 2024. PMID: 39012607 - Detection of DNA Methylation by Whole-Genome Bisulfite Sequencing.
Li Q, Hermanson PJ, Springer NM. Li Q, et al. Methods Mol Biol. 2018;1676:185-196. doi: 10.1007/978-1-4939-7315-6_11. Methods Mol Biol. 2018. PMID: 28986911 - Analyzing the cancer methylome through targeted bisulfite sequencing.
Lee EJ, Luo J, Wilson JM, Shi H. Lee EJ, et al. Cancer Lett. 2013 Nov 1;340(2):171-8. doi: 10.1016/j.canlet.2012.10.040. Epub 2012 Nov 28. Cancer Lett. 2013. PMID: 23200671 Free PMC article. Review. - Methodological aspects of whole-genome bisulfite sequencing analysis.
Adusumalli S, Mohd Omar MF, Soong R, Benoukraf T. Adusumalli S, et al. Brief Bioinform. 2015 May;16(3):369-79. doi: 10.1093/bib/bbu016. Epub 2014 May 27. Brief Bioinform. 2015. PMID: 24867940 Review.
Cited by
- Integrative Analysis of Methylation and Transcriptional Profiles to Reveal the Genetic Stability of Cashmere Traits in the Tβ4 Overexpression of Cashmere Goats.
Dai B, Zhang M, Yuan JL, Ren LQ, Han XY, Liu DJ. Dai B, et al. Animals (Basel). 2019 Nov 20;9(12):1002. doi: 10.3390/ani9121002. Animals (Basel). 2019. PMID: 31756916 Free PMC article. - DMRcaller: a versatile R/Bioconductor package for detection and visualization of differentially methylated regions in CpG and non-CpG contexts.
Catoni M, Tsang JM, Greco AP, Zabet NR. Catoni M, et al. Nucleic Acids Res. 2018 Nov 2;46(19):e114. doi: 10.1093/nar/gky602. Nucleic Acids Res. 2018. PMID: 29986099 Free PMC article. - Comprehensive analysis of DNA methylation data with RnBeads.
Assenov Y, Müller F, Lutsik P, Walter J, Lengauer T, Bock C. Assenov Y, et al. Nat Methods. 2014 Nov;11(11):1138-1140. doi: 10.1038/nmeth.3115. Epub 2014 Sep 28. Nat Methods. 2014. PMID: 25262207 Free PMC article. - Transgene-independent heredity of RdDM-mediated transcriptional gene silencing of endogenous genes in rice.
Wakasa Y, Kawakatsu T, Harada T, Takaiwa F. Wakasa Y, et al. Plant Biotechnol J. 2018 Dec;16(12):2007-2015. doi: 10.1111/pbi.12934. Epub 2018 May 30. Plant Biotechnol J. 2018. PMID: 29704881 Free PMC article. - Estimation of the methylation pattern distribution from deep sequencing data.
Lin P, Forêt S, Wilson SR, Burden CJ. Lin P, et al. BMC Bioinformatics. 2015 May 6;16:145. doi: 10.1186/s12859-015-0600-6. BMC Bioinformatics. 2015. PMID: 25943746 Free PMC article.
References
- Fraga M, Esteller M. DNA methylation: a profile of methods and applications. Biotechniques. 2002;33:632, 634, 636–649. - PubMed
Publication types
MeSH terms
Substances
LinkOut - more resources
Full Text Sources
Other Literature Sources
