Selective mRNA translation during eIF2 phosphorylation induces expression of IBTKα - PubMed (original) (raw)
Selective mRNA translation during eIF2 phosphorylation induces expression of IBTKα
Thomas D Baird et al. Mol Biol Cell. 2014 May.
Abstract
Disruption of protein folding in the endoplasmic reticulum (ER) triggers the unfolded protein response (UPR), a transcriptional and translational control network designed to restore protein homeostasis. Central to the UPR is PKR-like ER kinase (PERK/EIF2AK3) phosphorylation of the α subunit of eIF2 (eIF2α∼P), which represses global translation coincident with preferential translation of mRNAs, such as activating transcription factor 4 (ATF4) and C/EBP-homologous protein (CHOP), that serve to implement UPR transcriptional regulation. In this study, we used sucrose gradient ultracentrifugation and a genome-wide microarray approach to measure changes in mRNA translation during ER stress. Our analysis suggests that translational efficiencies vary over a broad range during ER stress, with the majority of transcripts being either repressed or resistant to eIF2α∼P, whereas a notable cohort of key regulators are subject to preferential translation. From the latter group, we identified the α isoform of inhibitor of Bruton's tyrosine kinase (IBTKα) as being subject to both translational and transcriptional induction during eIF2α∼P in both cell lines and a mouse model of ER stress. Translational regulation of IBTKα mRNA involves stress-induced relief of two inhibitory upstream open reading frames in the 5'-leader of the transcript. Depletion of IBTKα by short hairpin RNA reduced viability of cultured cells coincident with increased caspase 3/7 cleavage, suggesting that IBTKα is a key regulator in determining cell fate during the UPR.
© 2014 Baird et al. This article is distributed by The American Society for Cell Biology under license from the author(s). Two months after publication it is available to the public under an Attribution–Noncommercial–Share Alike 3.0 Unported Creative Commons License (http://creativecommons.org/licenses/by-nc-sa/3.0).
Figures
FIGURE 1:
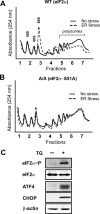
eIF2α∼P represses global translation initiation during ER stress. Polysome profiling was carried out using wild-type (A) or eIF2α−S51A (B) knock-in MEF cells treated with TG (ER stress) for 6 h or no stress treatment. (C) Immunoblot analysis of lysates prepared from wild-type MEF cells treated with TG for 6 h (+) or no stress. The indicated proteins were measured using antibodies specific to each.
FIGURE 2:
Genome-wide analyses of gene-specific translation during ER stress. (A) Number of gene transcripts as defined by analysis of the 22,862 probe sets associated with the indicated percentage of large polysomes in wild-type MEF cells treated with TG for 6 h or no stress. (B) Percentage association with large polysomes of the top 200 gene transcripts suggested to be preferentially translated in response to ER stress. (C) The categories of molecular and cellular functions as determined by ingenuity pathway analysis of the top 200 genes suggested to be subjected to preferential translation. (D) Scatterplot illustrating percentage shift toward large polysomes during stress suggestive of translational control (_y_-axis) vs. their relative mRNA fold changes in response to stress (_x_-axis, transcriptional control). (E) Venn diagram of the overlap between the 4007 genes encoding mRNAs that were significantly increased in response to ER stress (p < 0.05) and the top 200 genes suggested to be preferentially translated during ER stress. (F) Repressed genes encode mRNAs with significantly shorter 5′-UTRs than the stress-resistant cohort (one-way ANOVA with Tukey's HSD post hoc test, p = 0.0042). Lines of the box-plot diagram illustrate 75th, 50th, and 25th percentile values, and the + symbol indicates the arithmetic mean.
FIGURE 3:
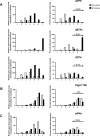
Changes in polysome association of gene transcripts suggest preferential, resistant, or repressed translation during ER stress. Fractions were collected by sucrose gradient analyses of lysates prepared from wild-type MEF cells treated with TG for 6 h (ER stress) or no stress. Relative levels of the indicated gene transcripts were then determined by qPCR for each fraction (left), with preferentially translated gene transcripts in response to ER stress (A), resistant (B), and repressed (C). For these values, gene expression was normalized to an exogenous polyadenylated Luciferase spike-in mRNA control. Right, percentage of total gene transcripts in each of the seven fractions prepared from the TG-treated and nonstressed cells. Percentage changes in association with large polysomes (fractions 5–7) in response to ER stress are indicated in each gene transcript panel. For example, ATF5 showed a 55% increase in transcripts levels into fractions 5–7 during ER stress compared with no stress.
FIGURE 4:
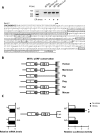
The 5′-leader of the IBTKα gene transcript confers preferential translation in response to eIF2α∼P. (A) 5′-RACE was performed to establish the transcriptional start site for _IBTK_α in the presence and absence of stress. The arrow indicates the transcriptional start site, and each of the four uORFs present in the _IBTK_α 5′-leader is boxed. 5′-RACE assays were performed using RNA-containing endogenous transcript and the luciferase translational reporters prepared from cells treated with TG or no stress. The image of the cDNA products that were analyzed by agarose gel electrophoresis is presented above the _IBTK_α sequence. (B) Schematic of phylogenetic conservation of uORFs in the 5′-leader of the _IBTK_α mRNA among different mammalian species. (C) _IBTK_α translational control was measured by a dual luciferase assay. The P_TK_-_IBTK_α-Luc reporter, which contains the _IBTK_α leader sequence, and a control Renilla luciferase plasmid, were introduced into wild-type or eIF2α-S51A MEF cells and treated with TG or no stress. Three independent experiments were conducted for each measurement, and relative values are represented, with the SD indicated. In parallel, levels of IBTK_α_-Luc mRNA were measured by qPCR, and relative values are presented, with error bars representing SD. The asterisk indicates a significant difference in wild-type MEF cells in response to ER stress, and the number sign (#) between wild-type and eIF2α-S51A cells during TG treatment (p < 0.001).
FIGURE 5:
Translation of IBTK_α mRNA is regulated by a scanning model involving two inhibitory upstream ORFs. Wild-type and the depicted mutant versions of the PTK-IBTKα-Luc reporter were analyzed in MEF cells subject to TG or no stress treatment. The 5′-leader of the IBTKα mRNA is illustrated upstream of the firefly luciferase reporter. Boxes indicate uORFs 1–4, and the numbers in the wild-type leader depiction represent the number of nucleotides separating the ORFs. Relative luciferase activities are shown after ER stress or no stress treatment, with error bars indicating SD. Left, relative levels of the reporter mRNAs as measured by qPCR. The stem-loop structure (Δ_G = – 41 kcal/mol) adjacent to the 5′-end of the reporter is illustrated, and the X indicates mutations of the start codon for the indicated uORF.
FIGURE 6:
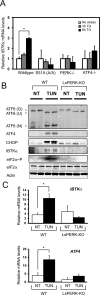
Enhanced _IBTK_α gene expression requires PERK in both cultured cell and animal models of ER stress. (A) _IBTK_α mRNA levels were measured by qPCR in wild-type and mutant MEF cells treated with TG for 3 or 6 h or no stress (0). The error bars indicate SD, and the asterisk indicates significant enhancement in transcript levels in response to the ER stress (p < 0.05). (B) Wild-type and liver-specific PERK knockout (LsPERK-KO) mice were subjected to a single intraperitoneal injection of tunicamycin or saline control and killed after 6 h. Lysates were prepared and immunoblot analyses carried out using antibodies against the indicated proteins. (C) Alternatively, RNA was prepared from the LsPERK-KO livers and qPCR analyses were carried out to measure _IBTK_α or ATF4 mRNA levels. The error bars indicate SD, and the asterisk indicates significant increase in transcript levels in response to ER stress (p < 0.005).
FIGURE 7:
Knockdown of IBTKα reduces cell viability and increases caspase 3/7 cleavage. shRNAs against _IBTK_α and a lentiviral delivery system were used to knock down _IBTK_α expression in wild-type MEF cells. (A) qPCR measurements of IBTKα mRNA in knockdown cells (KD) and control shRNA–expressing cells (scrambled). (B) _IBTK_α-KD and control MEF cells expressing scrambled shRNA were plated in culture dishes at low or high density. Cell numbers were determined upon culturing for up to 72 h. (C) Measurements of cell proliferation by EdU incorporation during cell culture normalized to day 0. (D) Hoescht-stained, EdU-stained, and merged _IBTK_α-KD and scrambled control cells. (E) Measurements of caspase 3/7 cleavage in MEF cells and HepG2 cells expressing IBTKα shRNA (IBTKα-KD) or scramble shRNA.
FIGURE 8:
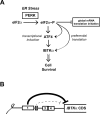
Model depicting _IBTK_α transcriptional and translational regulation during PERK induced eIF2α∼P. (A) During ER stress, the PERK arm of the UPR directs phosphorylation of eIF2α, resulting in global dampening of translation initiation. During this decrease in global mRNA translation, ATF4 and its downstream target IBTKα are suggested to be both transcriptionally induced and subject to preferential translation, which collectively can determine cell viability during ER stress. (B) The inhibitory uORFs 1 and 2 serve to repress _IBTK_α translational expression. uORF1 is a major inhibitory element, with uORF2 serving a secondary role. In response to ER stress, eIF2α∼P overcomes these inhibitory elements to translate the downstream _IBTK_α CDS.
Similar articles
- Function of inhibitor of Bruton's tyrosine kinase isoform α (IBTKα) in nonalcoholic steatohepatitis links autophagy and the unfolded protein response.
Willy JA, Young SK, Mosley AL, Gawrieh S, Stevens JL, Masuoka HC, Wek RC. Willy JA, et al. J Biol Chem. 2017 Aug 25;292(34):14050-14065. doi: 10.1074/jbc.M117.799304. Epub 2017 Jul 14. J Biol Chem. 2017. PMID: 28710282 Free PMC article. - Methods for analyzing eIF2 kinases and translational control in the unfolded protein response.
Teske BF, Baird TD, Wek RC. Teske BF, et al. Methods Enzymol. 2011;490:333-56. doi: 10.1016/B978-0-12-385114-7.00019-2. Methods Enzymol. 2011. PMID: 21266259 - The eIF2 kinase PERK and the integrated stress response facilitate activation of ATF6 during endoplasmic reticulum stress.
Teske BF, Wek SA, Bunpo P, Cundiff JK, McClintick JN, Anthony TG, Wek RC. Teske BF, et al. Mol Biol Cell. 2011 Nov;22(22):4390-405. doi: 10.1091/mbc.E11-06-0510. Epub 2011 Sep 14. Mol Biol Cell. 2011. PMID: 21917591 Free PMC article. - The Role of the PERK/eIF2α/ATF4/CHOP Signaling Pathway in Tumor Progression During Endoplasmic Reticulum Stress.
Rozpedek W, Pytel D, Mucha B, Leszczynska H, Diehl JA, Majsterek I. Rozpedek W, et al. Curr Mol Med. 2016;16(6):533-44. doi: 10.2174/1566524016666160523143937. Curr Mol Med. 2016. PMID: 27211800 Free PMC article. Review. - Endoplasmic reticulum stress and eIF2α phosphorylation: The Achilles heel of pancreatic β cells.
Cnop M, Toivonen S, Igoillo-Esteve M, Salpea P. Cnop M, et al. Mol Metab. 2017 Jul 12;6(9):1024-1039. doi: 10.1016/j.molmet.2017.06.001. eCollection 2017 Sep. Mol Metab. 2017. PMID: 28951826 Free PMC article. Review.
Cited by
- mTORC1 and CK2 coordinate ternary and eIF4F complex assembly.
Gandin V, Masvidal L, Cargnello M, Gyenis L, McLaughlan S, Cai Y, Tenkerian C, Morita M, Balanathan P, Jean-Jean O, Stambolic V, Trost M, Furic L, Larose L, Koromilas AE, Asano K, Litchfield D, Larsson O, Topisirovic I. Gandin V, et al. Nat Commun. 2016 Apr 4;7:11127. doi: 10.1038/ncomms11127. Nat Commun. 2016. PMID: 27040916 Free PMC article. - To die or not to die: death signaling in nonalcoholic fatty liver disease.
Akazawa Y, Nakao K. Akazawa Y, et al. J Gastroenterol. 2018 Aug;53(8):893-906. doi: 10.1007/s00535-018-1451-5. Epub 2018 Mar 24. J Gastroenterol. 2018. PMID: 29574534 Free PMC article. Review. - Noncanonical translation via deadenylated 3' UTRs maintains primordial germ cells.
Jin YN, Schlueter PJ, Jurisch-Yaksi N, Lam PY, Jin S, Hwang WY, Yeh JJ, Yoshigi M, Ong SE, Schenone M, Hartigan CR, Carr SA, Peterson RT. Jin YN, et al. Nat Chem Biol. 2018 Sep;14(9):844-852. doi: 10.1038/s41589-018-0098-0. Epub 2018 Jul 9. Nat Chem Biol. 2018. PMID: 29988067 Free PMC article. - Ribosome Reinitiation Directs Gene-specific Translation and Regulates the Integrated Stress Response.
Young SK, Willy JA, Wu C, Sachs MS, Wek RC. Young SK, et al. J Biol Chem. 2015 Nov 20;290(47):28257-28271. doi: 10.1074/jbc.M115.693184. Epub 2015 Oct 7. J Biol Chem. 2015. PMID: 26446796 Free PMC article. - Embryonic lethal abnormal vision proteins and adenine and uridine-rich element mRNAs after global cerebral ischemia and reperfusion in the rat.
Wang H, Tri Anggraini F, Chen X, DeGracia DJ. Wang H, et al. J Cereb Blood Flow Metab. 2017 Apr;37(4):1494-1507. doi: 10.1177/0271678X16657572. Epub 2016 Jan 1. J Cereb Blood Flow Metab. 2017. PMID: 27381823 Free PMC article.
References
- Delepine M, Nicolino M, Barrett T, Golamaully M, Lathrop GM, Julier C. EIF2AK3, encoding translation initiation factor 2-a kinase 3, is mutated in patients with Wolcott-Rallison syndrome. Nat Genet. 2000;25:406–409. - PubMed
- Hadjebi O, Casas-Terradellas E, Garcia-Gonzalo FR, Rosa JL. The RCC1 superfamily: from genes, to function, to disease. Biochim Biophys Acta. 2008;1783:1467–1479. - PubMed
- Harding HP, Novoa I, Zhang Y, Zeng H, Wek R, Schapira M, Ron D. Regulated translation initiation controls stress-induced gene expression in mammalian cells. Mol Cell. 2000;6:1099–1108. - PubMed
Publication types
MeSH terms
Substances
Grants and funding
- R01 GM049164/GM/NIGMS NIH HHS/United States
- T32 DK064466/DK/NIDDK NIH HHS/United States
- R01 HD070487/HD/NICHD NIH HHS/United States
- GM049164/GM/NIGMS NIH HHS/United States
- T32DK064466/DK/NIDDK NIH HHS/United States
LinkOut - more resources
Full Text Sources
Other Literature Sources
Research Materials
