Development of a conditionally immortalized human pancreatic β cell line - PubMed (original) (raw)
Development of a conditionally immortalized human pancreatic β cell line
Raphaël Scharfmann et al. J Clin Invest. 2014 May.
Abstract
Diabetic patients exhibit a reduction in β cells, which secrete insulin to help regulate glucose homeostasis; however, little is known about the factors that regulate proliferation of these cells in human pancreas. Access to primary human β cells is limited and a challenge for both functional studies and drug discovery progress. We previously reported the generation of a human β cell line (EndoC-βH1) that was generated from human fetal pancreas by targeted oncogenesis followed by in vivo cell differentiation in mice. EndoC-βH1 cells display many functional properties of adult β cells, including expression of β cell markers and insulin secretion following glucose stimulation; however, unlike primary β cells, EndoC-βH1 cells continuously proliferate. Here, we devised a strategy to generate conditionally immortalized human β cell lines based on Cre-mediated excision of the immortalizing transgenes. The resulting cell line (EndoC-βH2) could be massively amplified in vitro. After expansion, transgenes were efficiently excised upon Cre expression, leading to an arrest of cell proliferation and pronounced enhancement of β cell-specific features such as insulin expression, content, and secretion. Our data indicate that excised EndoC-βH2 cells are highly representative of human β cells and should be a valuable tool for further analysis of human β cells.
Figures
Figure 1. Strategy to produce reversely immortalized cell line and immunofluorescence analysis of EndoC-βH2 cells.
(A) Schematic representation of excisable lentiviral vector used to produce the EndoC-βH2 reversely immortalized cell line. (B) Immunofluorescence analysis of EndoC-βH2 cells. EndoC-βH2 cells stained positive for insulin (INS) and coexpressed C-peptide (C-PEPT), CHGA, PDX1, NKX6.1, SV40 LT, and Ki67. The cells rarely express somatostatin (SST) and do not express glucagon (GCG), amylase (AMY), carboxipeptidase-A (CPA), or SOX9. Nuclei were stained with Hoechst 33342 fluorescent stain (blue). Photographs of all insulin stainings were taken using a 700 ms acquisition time to obtain an unsaturated signal. Scale bars: 50 μm.
Figure 2. Excision of immortalizing transgenes blocks proliferation.
EndoC-βH2 cells were transduced with either _Cre_- or _GFP_-expressing lentiviral vectors and analyzed 21 days later. (A) SV40 LT and hTERT expression were analyzed by RT-QPCR. Results are presented normalized to cyclophilin and relative to control nontransduced EndoC-βH2 cells. Results are shown as mean ± SD of 3 independent RNA preparations. The experiment was replicated 2 times. (B) Immunofluorescence analysis of SV40 LT (green) and insulin (red) in nonexcised cells (–CRE) and excised EndoC-βH2 cells (+CRE). Nuclei were stained with Hoechst 33342 fluorescent stain (blue). The settings of confocal images were used to obtain an unsaturated insulin signal for excised EndoC-βH2 cells. The same settings were used to generate the insulin image for nonexcised EndoC-βH2 cells. Scale bars: 50 μm. (C) Ki67 expression was analyzed by RT-QPCR. Results are presented normalized to cyclophilin and relative to control nontransduced EndoC-βH2 cells. Results are shown as mean ± SD of 3 independent RNA preparations. (D). BrdU incorporation by nonexcised and excised EndoC-βH2 cells following a 1-hour BrdU pulse. Results are presented as a mean percentage ± SD.
Figure 3. Excision of immortalizing transgenes modulates the expression of cell-cycle–related genes.
Heat map comparisons of the expression of a set of cell-cycle–related genes in EndoC-βH2 nonexcised cells and excised cells versus human islets. The heat map shows the log intensities in 3 sample sets of EndoC-βH2 nonexcised or excised cells and human islets (42). For genes represented by several probe sets, the probe set with the highest fold change was used. Gene list is ordered from low to high expression relative to human islet sample. Gene lists have been generated using published transcriptomic data (43), literature data, and manual curation.
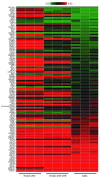
Figure 4. Heat map visualization of gene expression profiling in excised and unexcised EndoC-βH2 compared with human islets and exocrine cell line.
(A) Expression of genes relevant for β cell function in heat map visualization. The heat map shows the log intensities in 3 sample sets of EndoC-βH2 nonexcised or excised cells, human islets (42), and pancreas exocrine cell line SKPC. For genes represented by several probe sets, the probe set with the highest fold change was used. Most genes are highly expressed in the human β cell line EndoC-βH2 and in islet samples, but not in exocrine cell line SKPC. (B) Expression of exocrine marker genes in heat map visualization. The heat map shows the log intensities in 3 sample sets of EndoC-βH2 nonexcised or excised cells, human islets (42), and pancreas exocrine cell line SKPC. Gene lists have been generated using published transcriptomics data (43), literature data, and manual curation. For genes represented by several probe sets, the probe set with the highest fold change was used. Most genes are not expressed in human β cell line EndoC-βH2 samples (excised or not), but in islet samples.
Figure 5. Enhanced β cell–specific gene expression following excision.
EndoC-βH2 cells were transduced with either _Cre_- or GFP-expressing lentiviral vectors and analyzed 21 days later. (A) Insulin expression was analyzed by RT-QPCR and compared with its expression in EndoC-βH1 and SKPC cells. Results are presented normalized to cyclophilin and relative to control nontransduced EndoC-βH2 cells. Results are mean ± SD of 3 independent RNA preparations. (B) Immunofluorescence analysis of insulin (red) in nonexcised cells (–CRE) and excised EndoC-βH2 cells (+CRE). Nuclei were stained with Hoechst 33342 fluorescent stain (blue). Scale bars: 100 μm. (C) Immunofluorescence analysis of insulin (red) and Ki67 (green) in nonexcised cells (–CRE) and excised EndoC-βH2 cells (+CRE). Nuclei were stained with Hoechst 33342 fluorescent stain (blue). Scale bars: 50 μm (left and middle panel); 25 μm (right panel). In B and C, specific settings were applied in order to obtain confocal images with un-saturated insulin signal for excised EndoC-βH2 cells. The same settings were used to generate the insulin images for nonexcised EndoC-βH2 cells. (D) Insulin content in nonexcised and excised EndoC-βH2 cells. Results are shown as mean ± SEM of 3 independent cultures. The experiment was replicated 2 times. (E) IAPP, SLC2A2, ABCC8, KCNJ11, and RAB3A expression was analyzed by RT-QPCR. Results are presented normalized to cyclophilin and relative to control nontransduced EndoC-βH2 cells. Results are shown as mean ± SD of 3 independent RNA preparations.
Figure 6. Expression of β cell transcription factors before and after excision.
RT-QPCR was performed to compare the level of expression of a set of β cell transcription factors (MAFA, GLIS3, RFX6, NKX2-2, NKX6-1, PDX1, MYT1, MNX1, and PAX6) among EndoC-βH2 nonexcised control cells, Cre-transduced excised EndoC-βH2 cells, GFP-transduced EndoC-βH2 cells, and islets. QPCR was normalized relative to TBP expression, and the relative expression of each transcription factor was arbitrary set to 1 for the control nonexcised EndoC-βH2 cells. Three independent RNA extractions were performed for each culture condition (control, Cre, and GFP) and 1 for the human islet preparation. QPCR was performed in quadruplicate. Results are shown as mean ± SEM. *P < 0.0002, unpaired 2-tailed Student’s t test with Welch correction.
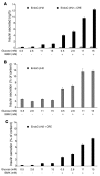
Figure 7. Insulin secretion by EndoC-βH2 cells following _Cre_-mediated excision.
EndoC-βH2 cells were transduced with _Cre_-expressing lentiviral vectors and analyzed 21 days later. Control nonexcised and excised EndoC-βH2 cells were tested for static insulin secretion under various glucose concentrations in the presence or absence of IBMX. In A, results are expressed as ng of secreted insulin per hour. In B and C, insulin secretion is presented as percentage of insulin content. Results are presented as mean ± SEM of 3 independent wells per condition assayed by ELISA. The experiment was replicated 2 times.
Similar articles
- Characterization of stimulus-secretion coupling in the human pancreatic EndoC-βH1 beta cell line.
Andersson LE, Valtat B, Bagge A, Sharoyko VV, Nicholls DG, Ravassard P, Scharfmann R, Spégel P, Mulder H. Andersson LE, et al. PLoS One. 2015 Mar 24;10(3):e0120879. doi: 10.1371/journal.pone.0120879. eCollection 2015. PLoS One. 2015. PMID: 25803449 Free PMC article. - The EndoC-βH1 cell line is a valid model of human beta cells and applicable for screenings to identify novel drug target candidates.
Tsonkova VG, Sand FW, Wolf XA, Grunnet LG, Kirstine Ringgaard A, Ingvorsen C, Winkel L, Kalisz M, Dalgaard K, Bruun C, Fels JJ, Helgstrand C, Hastrup S, Öberg FK, Vernet E, Sandrini MPB, Shaw AC, Jessen C, Grønborg M, Hald J, Willenbrock H, Madsen D, Wernersson R, Hansson L, Jensen JN, Plesner A, Alanentalo T, Petersen MBK, Grapin-Botton A, Honoré C, Ahnfelt-Rønne J, Hecksher-Sørensen J, Ravassard P, Madsen OD, Rescan C, Frogne T. Tsonkova VG, et al. Mol Metab. 2018 Feb;8:144-157. doi: 10.1016/j.molmet.2017.12.007. Epub 2017 Dec 19. Mol Metab. 2018. PMID: 29307512 Free PMC article. - A human beta cell line with drug inducible excision of immortalizing transgenes.
Benazra M, Lecomte MJ, Colace C, Müller A, Machado C, Pechberty S, Bricout-Neveu E, Grenier-Godard M, Solimena M, Scharfmann R, Czernichow P, Ravassard P. Benazra M, et al. Mol Metab. 2015 Oct 20;4(12):916-25. doi: 10.1016/j.molmet.2015.09.008. eCollection 2015 Dec. Mol Metab. 2015. PMID: 26909308 Free PMC article. - Pancreatic acinar-to-beta cell transdifferentiation in vitro.
Minami K, Seino S. Minami K, et al. Front Biosci. 2008 May 1;13:5824-37. doi: 10.2741/3119. Front Biosci. 2008. PMID: 18508625 Review. - Tripeptide amide L-pyroglutamyl-histidyl-L-prolineamide (L-PHP-thyrotropin-releasing hormone, TRH) promotes insulin-producing cell proliferation.
Luo L, Luo JZ, Jackson I. Luo L, et al. Curr Aging Sci. 2013 Feb;6(1):8-13. doi: 10.2174/1874609811306010002. Curr Aging Sci. 2013. PMID: 23895518 Review.
Cited by
- Menin-regulated Pbk controls high fat diet-induced compensatory beta cell proliferation.
Ma J, Xing B, Cao Y, He X, Bennett KE, Tong C, An C, Hojnacki T, Feng Z, Deng S, Ling S, Xie G, Wu Y, Ren Y, Yu M, Katona BW, Li H, Naji A, Hua X. Ma J, et al. EMBO Mol Med. 2021 May 7;13(5):e13524. doi: 10.15252/emmm.202013524. Epub 2021 Apr 6. EMBO Mol Med. 2021. PMID: 33821572 Free PMC article. - Characterization of stimulus-secretion coupling in the human pancreatic EndoC-βH1 beta cell line.
Andersson LE, Valtat B, Bagge A, Sharoyko VV, Nicholls DG, Ravassard P, Scharfmann R, Spégel P, Mulder H. Andersson LE, et al. PLoS One. 2015 Mar 24;10(3):e0120879. doi: 10.1371/journal.pone.0120879. eCollection 2015. PLoS One. 2015. PMID: 25803449 Free PMC article. - Reduced miR-184-3p expression protects pancreatic β-cells from lipotoxic and proinflammatory apoptosis in type 2 diabetes via CRTC1 upregulation.
Grieco GE, Brusco N, Fignani D, Nigi L, Formichi C, Licata G, Marselli L, Marchetti P, Salvini L, Tinti L, Po A, Ferretti E, Sebastiani G, Dotta F. Grieco GE, et al. Cell Death Discov. 2022 Jul 29;8(1):340. doi: 10.1038/s41420-022-01142-x. Cell Death Discov. 2022. PMID: 35906204 Free PMC article. - Glucose controls co-translation of structurally related mRNAs via the mTOR and eIF2 pathways in human pancreatic beta cells.
Bulfoni M, Bouyioukos C, Zakaria A, Nigon F, Rapone R, Del Maestro L, Ait-Si-Ali S, Scharfmann R, Cosson B. Bulfoni M, et al. Front Endocrinol (Lausanne). 2022 Aug 5;13:949097. doi: 10.3389/fendo.2022.949097. eCollection 2022. Front Endocrinol (Lausanne). 2022. PMID: 35992129 Free PMC article. - [Research progress on the donor cell sources of pancreatic islet transplantation for treatment of diabetes mellitus].
Zhu H, Zhang X, He Y, Yu L, Lü Y, Pan K, Wang B, Chen G. Zhu H, et al. Zhongguo Xiu Fu Chong Jian Wai Ke Za Zhi. 2018 Jan 15;32(1):104-111. doi: 10.7507/1002-1892.201707049. Zhongguo Xiu Fu Chong Jian Wai Ke Za Zhi. 2018. PMID: 29806374 Free PMC article. Review. Chinese.
References
Publication types
MeSH terms
Substances
LinkOut - more resources
Full Text Sources
Other Literature Sources
Molecular Biology Databases
Research Materials
Miscellaneous


