OMA1 mediates OPA1 proteolysis and mitochondrial fragmentation in experimental models of ischemic kidney injury - PubMed (original) (raw)
OMA1 mediates OPA1 proteolysis and mitochondrial fragmentation in experimental models of ischemic kidney injury
Xiao Xiao et al. Am J Physiol Renal Physiol. 2014.
Abstract
Acute kidney injury (AKI) is associated with mitochondrial fragmentation, which contributes to mitochondrial damage and tubular cell apoptosis. Mitochondrial fragmentation involves the cleavage of both mitochondrial outer and inner membranes. Cleavage of the outer membrane results from Drp-1-mediated fission activation and Bak-promoted fusion arrest, but the molecular mechanism of inner membrane cleavage remains elusive. OMA1-mediated proteolysis of OPA1, a key inner membrane fusion protein, was recently suggested to account for inner membrane cleavage during cell stress. In this study, we determined the role of OMA1 in OPA1 proteolysis and mitochondrial fragmentation in experimental models of ischemic AKI. In ATP-depletion injury, knockdown of OMA1 suppressed OPA1 proteolysis, mitochondrial fragmentation, cytochrome c release, and consequent apoptosis in renal proximal tubular cells. In mice, OMA1 deficiency prevented ischemic AKI as indicated by better renal function, less tubular damage, and lower apoptosis. OPA1 proteolysis and mitochondrial injury during ischemic AKI were ameliorated in OMA1-deficient mice. Thus, OMA1-mediated OPA1 proteolysis plays an important role in the disruption of mitochondrial dynamics in ischemic AKI.
Keywords: acute kidney injury; apoptosis; ischemia-reperfusion; mitochondria.
Copyright © 2014 the American Physiological Society.
Figures
Fig. 1.
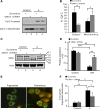
OMA1 knockdown suppresses ATP depletion-induced apoptosis in rat kidney proximal tubular cell line cells (RPTCs). RPTCs were transfected with OMA1-shRNA or scrambled sequence shRNA plasmids to generate stable cell lines. The cells were then left untreated (control) or treated with 10 mM sodium azide in glucose-free buffer for 2.5 h to induce ATP depletion (A), followed by 3 h of recovery in fresh culture medium (A/R). A: representative immunoblots showing OMA1 knockdown in OMA1-shRNA transfected cells; β-actin was probed as internal protein control. B: densitometry quantification of immunoblots confirming OMA1 knockdown in OMA1-shRNA transfected cells (n = 3). *P < 0.05. C: representative images of cell morphology (top) and nuclear morphology after Hochest staining (bottom). D: percentage of apoptosis evaluated by counting the cells with typical apoptotic morphology (n = 3). *P < 0.05. **P < 0.01. E: immunoblot of cleaved, active caspase 3. F: quantitative analysis of cleaved, active caspase 3 by densitometry. *P < 0.05. **P < 0.01.
Fig. 2.
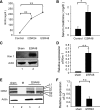
OMA1 knockdown inhibits ATP depletion-induced OPA1 proteolysis, mitochondrial fragmentation, and cytochrome c (Cyt c) release. OMA1 shRNA or scrambled sequence transfected RPTCs were left untreated (control) or treated with 10 mM sodium azide to induce ATP depletion. A: immunoblots of Cyt c. Cells were fractionated into mitochondria-enriched membrane fraction and cytosolic fraction for immunoblot analysis. B: quantification of percentage of Cyt c in cytosol and mitochondria. The Cyt c bands were analyzed by densitometry. The signals were used to calculate the percentages. *P < 0.05. C: immunoblot of OPA1 in whole cell lysate. The long (L1, L2) and short (S1, S2, S3) OPA1 isoforms are indicated. β-Actin was used as a loading control. D: OPA-L2 bands were analyzed by densitometry to calculate its degradation upon treatment (n = 3). **P < 0.01. ns, No significance. E: representative images of RPTCs with fragmented or filamentous mitochondria. F: quantification of percentage of cells with fragmented mitochondria (n = 3). *P < 0.05. **P < 0.01.
Fig. 3.
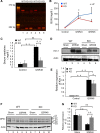
OPA1 proteolysis occurs during renal ischemia-reperfusion in mice. C57BL/6 mice were subjected to 25 min of bilateral renal ischemia followed by 48 h of reperfusion (I25R48). A: blood urea nitrogen (BUN) values for mice before (control) and I25R24 and I25R48 (n = 4). **P < 0.01. B: serum creatinine values at 48 h of reperfusion (n = 4). *P < 0.05. C: immunoblot of kidney injury molecule (Kim 1) at conditions of sham and I25R48. D: quantification of Kim 1 (n = 4). **P < 0.01. E: immunoblot of OPA1 showing OPA1 proteolysis during renal ischemia-reperfusion. F: densitometry analysis of OPA1-L2 degradation during renal ischemia-reperfusion (n = 4). **P < 0.01.
Fig. 4.
OMA1 knockout (KO) protects renal function and reduces OPA1 proteolysis in ischemic acute kidney injury (AKI). Male littermates of wild-type (WT) and OMA1-KO mice were subjected to 25 min of bilateral renal ischemia and 48 h of reperfusion. A: PCR-based genotyping results to confirm OMA1 deletion in KO mice. WT allele, 379 bp; OMA1-KO allele, 252 bp. B: BUN values for WT and KO mice before surgery (control) and during renal ischemia-reperfusion (I25R24 and I25R48; n = 5 pairs). #P < 0.05 vs. KO mice at I25R48. *P < 0.05, **P < 0.01 vs. control. C: serum creatinine for WT and KO mice before surgery (control) and at 48 h of reperfusion (I25R48; n = 5 pairs). **P < 0.01. D: immunoblots of Kim-1 for WT and KO mice with sham and I25R48 operations. E: quantification of relative expression of Kim 1 (n = 3 pairs). *P < 0.05, **P < 0.01. F: immunoblot of OPA1 showing the changes of various OPA1 isoforms during renal ischemia-reperfusion in the WT and KO mice. β-Actin was probed as loading control. G: densitometry analysis of OPA1-L2 (n = 3 pairs). **P < 0.01.
Fig. 5.
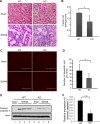
Tubular damage and apoptosis are attenuated in OMA1-KO mice during renal ischemia-reperfusion. Kidney tissues with or without 25 min of ischemia and 48 h of reperfusion were fixed and processed for paraffin embedding, followed by hematoxylin and eosin (H & E) or TdT-mediated dUTP nick end labeling (TUNEL) staining. A: representative images of H & E staining. B: kidney tubular damage score from H & E staining for WT and KO mice with ischemic AKI (I25R48). *P < 0.05. C: representative images of TUNEL staining. D: quantification of apoptotic cells from TUNEL images (bottom; n = 5). *P < 0.05. E: immunoblot analysis of cleaved caspase 3 during renal ischemia-reperfusion in WT and KO mice. F: densitometry quantification of cleaved caspase 3 (n = 3 pairs). **P < 0.01.
Fig. 6.
Resistance of OMA1-KO tissues to mitochondrial fragmentation and cytochrome c release in ischemic AKI. A, B: male littermates of WT and OMA1-KO mice were subjected to 25 min of bilateral renal ischemia and a brief period (∼15 min) of reperfusion. Kidney tissues were fixed and processed for electron microscopy to record representative images (A) and quantify the cells with fragmented mitochondria in collected images (B). C: mice were subjected to 25 min of bilateral renal ischemia and 16 h of reperfusion. Kidney tissues were collected to separate mitochondrial and cytosol fractions for immunoblot analysis of cytochrome c. D: densitometry analysis of cytochrome c in cytosol and mitochondria.
Similar articles
- Mitochondrial membrane potential and oxidative stress interact to regulate Oma1-dependent processing of Opa1 and mitochondrial dynamics.
Fogo GM, Raghunayakula S, Emaus KJ, Torres Torres FJ, Wider JM, Sanderson TH. Fogo GM, et al. FASEB J. 2024 Sep 30;38(18):e70066. doi: 10.1096/fj.202400313R. FASEB J. 2024. PMID: 39312414 - Loss of UCP2 causes mitochondrial fragmentation by OMA1-dependent proteolytic processing of OPA1 in podocytes.
Yang Q, Wang L, Liang Y, He Q, Sun Q, Luo J, Cao H, Fang Y, Zhou Y, Yang J, Wen P, Jiang L. Yang Q, et al. FASEB J. 2023 Nov;37(11):e23265. doi: 10.1096/fj.202301055R. FASEB J. 2023. PMID: 37874273 - miR-214 represses mitofusin-2 to promote renal tubular apoptosis in ischemic acute kidney injury.
Yan Y, Ma Z, Zhu J, Zeng M, Liu H, Dong Z. Yan Y, et al. Am J Physiol Renal Physiol. 2020 Apr 1;318(4):F878-F887. doi: 10.1152/ajprenal.00567.2019. Epub 2020 Jan 31. Am J Physiol Renal Physiol. 2020. PMID: 32003595 Free PMC article. - A cut short to death: Parl and Opa1 in the regulation of mitochondrial morphology and apoptosis.
Pellegrini L, Scorrano L. Pellegrini L, et al. Cell Death Differ. 2007 Jul;14(7):1275-84. doi: 10.1038/sj.cdd.4402145. Epub 2007 Apr 20. Cell Death Differ. 2007. PMID: 17464328 Review. - OPA1 processing in cell death and disease - the long and short of it.
MacVicar T, Langer T. MacVicar T, et al. J Cell Sci. 2016 Jun 15;129(12):2297-306. doi: 10.1242/jcs.159186. Epub 2016 May 17. J Cell Sci. 2016. PMID: 27189080 Review.
Cited by
- Comparative effects of 3,5-diiodo-L-thyronine and 3,5,3'-triiodo-L-thyronine on mitochondrial damage and cGAS/STING-driven inflammation in liver of hypothyroid rats.
Giacco A, Petito G, Silvestri E, Scopigno N, Vigliotti M, Mercurio G, de Lange P, Lombardi A, Moreno M, Goglia F, Lanni A, Senese R, Cioffi F. Giacco A, et al. Front Endocrinol (Lausanne). 2024 Sep 5;15:1432819. doi: 10.3389/fendo.2024.1432819. eCollection 2024. Front Endocrinol (Lausanne). 2024. PMID: 39301315 Free PMC article. - Mitochondrial fusion and fission proteins as novel therapeutic targets for treating cardiovascular disease.
Ong SB, Kalkhoran SB, Cabrera-Fuentes HA, Hausenloy DJ. Ong SB, et al. Eur J Pharmacol. 2015 Sep 15;763(Pt A):104-14. doi: 10.1016/j.ejphar.2015.04.056. Epub 2015 May 16. Eur J Pharmacol. 2015. PMID: 25987420 Free PMC article. Review. - Mitophagy in Acute Kidney Injury and Kidney Repair.
Wang Y, Cai J, Tang C, Dong Z. Wang Y, et al. Cells. 2020 Feb 1;9(2):338. doi: 10.3390/cells9020338. Cells. 2020. PMID: 32024113 Free PMC article. Review. - Sensing, signaling and surviving mitochondrial stress.
Eckl EM, Ziegemann O, Krumwiede L, Fessler E, Jae LT. Eckl EM, et al. Cell Mol Life Sci. 2021 Aug;78(16):5925-5951. doi: 10.1007/s00018-021-03887-7. Epub 2021 Jul 6. Cell Mol Life Sci. 2021. PMID: 34228161 Free PMC article. Review. - Mitochondrial Diseases Part II: Mouse models of OXPHOS deficiencies caused by defects in regulatory factors and other components required for mitochondrial function.
Iommarini L, Peralta S, Torraco A, Diaz F. Iommarini L, et al. Mitochondrion. 2015 May;22:96-118. doi: 10.1016/j.mito.2015.01.008. Epub 2015 Jan 29. Mitochondrion. 2015. PMID: 25640959 Free PMC article. Review.
References
- Belenguer P, Pellegrini L. The dynamin GTPase OPA1: more than mitochondria? Biochim Biophys Acta 1833: 176–183, 2013 - PubMed
- Brooks C, Dong Z. Regulation of mitochondrial morphological dynamics during apoptosis by Bcl-2 family proteins: a key in Bak? Cell Cycle 6: 3043–3047, 2007 - PubMed
Publication types
MeSH terms
Substances
LinkOut - more resources
Full Text Sources
Other Literature Sources
Molecular Biology Databases


