New perspectives in the renin-angiotensin-aldosterone system (RAAS) IV: circulating ACE2 as a biomarker of systolic dysfunction in human hypertension and heart failure - PubMed (original) (raw)
. 2014 Apr 1;9(4):e87845.
doi: 10.1371/journal.pone.0087845. eCollection 2014.
Miklós Fagyas 1, Ivetta Mányiné Siket 1, Attila Kertész 2, Zoltán Csanádi 2, Gábor Sándorfi 2, Marcell Clemens 2, Roland Fedor 3, Zoltán Papp 4, István Édes 5, Attila Tóth 4, Erzsébet Lizanecz 2
Affiliations
- PMID: 24691269
- PMCID: PMC3972189
- DOI: 10.1371/journal.pone.0087845
New perspectives in the renin-angiotensin-aldosterone system (RAAS) IV: circulating ACE2 as a biomarker of systolic dysfunction in human hypertension and heart failure
Katalin Úri et al. PLoS One. 2014.
Abstract
Background: Growing evidence exists for soluble Angiotensin Converting Enzyme-2 (sACE2) as a biomarker in definitive heart failure (HF), but there is little information about changes in sACE2 activity in hypertension with imminent heart failure and in reverse remodeling.
Methods, findings: Patients with systolic HF (NYHAII-IV, enrolled for cardiac resynchronisation therapy, CRT, n = 100) were compared to hypertensive patients (n = 239) and to a healthy cohort (n = 45) with preserved ejection fraction (EF>50%) in a single center prospective clinical study. The status of the heart failure patients were checked before and after CRT. Biochemical (ACE and sACE2 activity, ACE concentration) and echocardiographic parameters (EF, left ventricular end-diastolic (EDD) and end-systolic diameter (ESD) and dP/dt) were measured. sACE2 activity negatively correlated with EF and positively with ESD and EDD in all patient's populations, while it was independent in the healthy cohort. sACE2 activity was already increased in the hypertensive group, where signs for imminent heart failure (slightly decreased EF and barely increased NT-proBNP levels) were detected. sACE2 activities further increased in patients with definitive heart failure (EF<50%), while sACE2 activities decreased with the improvement of the heart failure after CRT (reverse remodeling). Serum angiotensin converting enzyme (ACE) concentrations were lower in the diseased populations, but did not show a strong correlation with the echocardiographic parameters.
Conclusions: Soluble ACE2 activity appears to be biomarker in heart failure, and in hypertension, where heart failure may be imminent. Our data suggest that sACE2 is involved in the pathomechanism of hypertension and HF.
Conflict of interest statement
Competing Interests: The authors have declared that no competing interests exist.
Figures
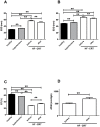
Figure 1. Echocardiographic parameters of the study populations.
Left ventricular echocardiographic parameters end systolic diameter (ESD, panel A), end diastolic diameter (EDD, panel B) and ejection fraction (EF, panel C) are shown in healthy people (healthy, n = 45, filled bars), patients with hypertension (hypertensive, n = 239, grey bars) and with severe heart failure (HF - CRT, n = 65, open bars). The kinetics of ventricular contractions (dP/dt) is shown in patients with severe heart failure (panel D, n = 22). Values in patients undergoing cardiac resynchronization therapy are shown before device implantation (HF - CRT, before) and after 6–9 months (HF - CRT, after). Unpaired echocardiographic values were analyzed by the nonparametric Kruskal-Wallis test (two tails, panel A–C). Paired echocardiographic data (CRT before and after, panel A–C and dP/dt, panel D) were evaluated by the nonparametric Wilcoxon matched-pairs signed rank test (two tails). Bars are mean ± S.E.M. Significant differences are labeled by asterisks (** P<0.001).
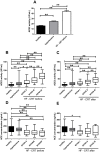
Figure 2. Differences in serum angiotensin converting enzyme activities and concentrations in study populations representing various clinical status of heart failure.
Serum ACE2 activity levels were determined in healthy people (healthy, n = 45, filled bar, panel A), patients with no apparent heart failure (hypertensive, n = 239, grey bar, panel A) and in patients with severe systolic heart failure (HF - CRT before, n = 100, open bars, panel A). Patients were also evaluated with respect of their New York Heart Association (NYHA) functional class (HF - CRT before: NYHAII: n = 31; NYHAIII: n = 55; NYHAIV: n = 14, panel B; HF - CRT after: NYHAI: n = 17; NYHAII: n = 37; NYHAIV: n = 11, panel C). Serum ACE concentration was also determined with respect of the New York Heart Association (NYHA) functional class of the patients before (HF – CRT before, panel D) and after CRT (HF – CRT after, panel E). Statistical analyses of healthy people, hypertensive, HF - CRT before and HF – CRT after groups were performed by one-way analysis of variance (ANOVA) followed by Newman-Keuls test for multiple comparisons between groups. Bars are mean ± S.E.M. Significant differences are labeled by asterisks (** P<0.001).
Figure 3. Serum ACE2 activity correlates with left ventricular ejection fraction.
Serum ACE2 activities were plotted as a function of left ventricular ejection fraction (EF), in healthy people (healthy, n = 45, panel A), in patients with preserved EF (hypertensive, n = 239, panel B and in patients with severe reduction in EF (HF - CRT before, n = 65, panel C). Serum ACE2 activities were also plotted as the function of the cardiac morphological parameters end systolic diameter (ESD, panel D) and end diastolic diameter (EDD, panel E) in heart failure patients before CRT (HF – CRT before). Each dot represents values of individual patients. Points were fitted by linear regression. The value P indicates the level of significance of the positive correlation between the plotted parameters, while r represents a measure of the goodness of the fit.
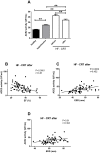
Figure 4. Serum ACE2 activity correlates with reverse remodeling.
Serum ACE2 activity was determined in healthy people (healthy, n = 45, filled bar), patients with preserved ejection fraction (hypertensive, n = 239, grey bar) and in patients with severe heart failure before (HF – CRT before) and after (HF – CRT after) cardiac resynchronization therapy (CRT, n = 65, open bars, panel A). Statistical analyses were performed by one-way analysis of variance (ANOVA) followed by Newman-Keuls test for multiple comparisons between groups. Bars represent mean ± S.E.M. Significant differences between values are labeled by asterisks (** P<0.001). In addition, individual values for the patients after CRT (HF – CRT after) are also shown (panels B–D). Serum ACE2 activities were plotted as a function of ejection fraction (EF, panel B), end systolic diameter (ESD, panel C) and end diastolic diameter (EDD, panel D). Plots were fitted by linear regression and the goodness of fits is indicated by the ‘r’ values, while the correlations are represented by the ‘P’ values.
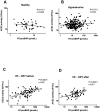
Figure 5. Positive correlation between sACE2 activity and NT-proBNP concentration.
Serum ACE2 activities were plotted as the function of NT Pro-Brain Natriuretic Peptide (NT-proBNP) concentrations in various study groups (healthy, n = 45, panel A, hypertensive, n = 239, panel B, HF - CRT before, n = 100, panel C, HF - CRT after, n = 65, panel D). Each dot represents values of individual patients in these plots. Points were fitted by linear regression. The value P indicates the level of significance of the positive correlation between the plotted parameters, while r represents a measure of the goodness of the fit.
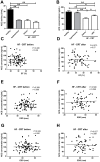
Figure 6. Serum ACE activity and concentration in patients with normal systolic left ventricular function and in patients with systolic heart failure.
Serum ACE activity (panel A) and ACE concentration (panel B) were measured in healthy people (n = 45, filled bar), in patients with preserved ejection fraction (hypertensive, n = 40, grey bar) and in patients with severe heart failure before (HF - CRT before) and after cardiac resynchronization therapy (HF - CRT after, n = 65, open bars). Statistical analyses of biochemical measurements was performed by one-way analysis of variance (ANOVA) followed by Newman-Keuls test for multiple comparisons between groups. Bars represent mean ± S.E.M. Significant differences are labeled by asterisks (* P<0.01 and ** P<0.001). Values for the individual patients were also plotted. Serum ACE concentration is showed as a function of the ejection fraction (EF, panels C and D), end systolic diameter (ESD, panels E and F) and end diastolic diameter (EDD, panels G and H). Plots were fitted by linear regression. Values for the goodness of the fits (r) and for the level of correlations (P) are also indicated.
Figure 7. Hypothetic model for RAS regulation in heart failure.
Angiotensin I (AngI) is being converted to angiotensin II (AngII) by angiotensin converting enzyme (ACE). AngII is further metabolized to angiotensin 1–7 (Ang-(1–7)) by sACE2. AngII binds to and activate the type 1 AngII receptors (AT1R), while Ang-(1–7) binds to and activate the Mas receptor. Levels of tissue located and soluble forms of these enzymes determine local levels of angiotensin peptides. We hypothesize that a significant redistribution of tissue and soluble ACE and ACE2 occurs in human heart failure which changes are reversible upon improvement of the cardiac function. In particular, sACE2 limits AngII levels under healthy conditions, resulting in a low level of ATR1 stimulation and high Mas receptor stimulation, a condition which is beneficial in cardiovascular physiology. However, ACE2 is probably re-distributed in imminent or definitive heart failure. As a result, its activity increases in the circulating blood, but decreases in the tissues. This result in higher local Ang II levels, higher AT1R stimulation and lower Mas receptor activation. These latter features being characteristic to heart failure.
Similar articles
- Detection of soluble angiotensin-converting enzyme 2 in heart failure: insights into the endogenous counter-regulatory pathway of the renin-angiotensin-aldosterone system.
Epelman S, Tang WH, Chen SY, Van Lente F, Francis GS, Sen S. Epelman S, et al. J Am Coll Cardiol. 2008 Aug 26;52(9):750-4. doi: 10.1016/j.jacc.2008.02.088. J Am Coll Cardiol. 2008. PMID: 18718423 Free PMC article. Clinical Trial. - Increasing serum soluble angiotensin-converting enzyme 2 activity after intensive medical therapy is associated with better prognosis in acute decompensated heart failure.
Shao Z, Shrestha K, Borowski AG, Kennedy DJ, Epelman S, Thomas JD, Tang WH. Shao Z, et al. J Card Fail. 2013 Sep;19(9):605-10. doi: 10.1016/j.cardfail.2013.06.296. J Card Fail. 2013. PMID: 24054336 Free PMC article. - Role of circulating angiotensin converting enzyme 2 in left ventricular remodeling following myocardial infarction: a prospective controlled study.
Ortiz-Pérez JT, Riera M, Bosch X, De Caralt TM, Perea RJ, Pascual J, Soler MJ. Ortiz-Pérez JT, et al. PLoS One. 2013 Apr 22;8(4):e61695. doi: 10.1371/journal.pone.0061695. Print 2013. PLoS One. 2013. PMID: 23630610 Free PMC article. - Angiotensin-converting enzyme 2 as a therapeutic target for heart failure.
Chamsi-Pasha MA, Shao Z, Tang WH. Chamsi-Pasha MA, et al. Curr Heart Fail Rep. 2014 Mar;11(1):58-63. doi: 10.1007/s11897-013-0178-0. Curr Heart Fail Rep. 2014. PMID: 24293035 Free PMC article. Review. - Recombinant human angiotensin-converting enzyme 2 as a new renin-angiotensin system peptidase for heart failure therapy.
Oudit GY, Penninger JM. Oudit GY, et al. Curr Heart Fail Rep. 2011 Sep;8(3):176-83. doi: 10.1007/s11897-011-0063-7. Curr Heart Fail Rep. 2011. PMID: 21611889 Review.
Cited by
- A brief review of interplay between vitamin D and angiotensin-converting enzyme 2: Implications for a potential treatment for COVID-19.
Malek Mahdavi A. Malek Mahdavi A. Rev Med Virol. 2020 Sep;30(5):e2119. doi: 10.1002/rmv.2119. Epub 2020 Jun 25. Rev Med Virol. 2020. PMID: 32584474 Free PMC article. Review. - Cardiovascular involvement during COVID-19 and clinical implications in elderly patients. A review.
Napoli C, Tritto I, Benincasa G, Mansueto G, Ambrosio G. Napoli C, et al. Ann Med Surg (Lond). 2020 Aug 5;57:236-243. doi: 10.1016/j.amsu.2020.07.054. eCollection 2020 Sep. Ann Med Surg (Lond). 2020. PMID: 32802325 Free PMC article. Review. - Contributions of human ACE2 and TMPRSS2 in determining host-pathogen interaction of COVID-19.
Senapati S, Banerjee P, Bhagavatula S, Kushwaha PP, Kumar S. Senapati S, et al. J Genet. 2021;100(1):12. doi: 10.1007/s12041-021-01262-w. J Genet. 2021. PMID: 33707363 Free PMC article. Review. - Outcomes With Multidisciplinary Cardiac Rehabilitation in Post-acute Systolic Heart Failure Patients-A Retrospective Propensity Score-Matched Study.
Chen SM, Wang LY, Liaw MY, Wu MK, Wu PJ, Wei CL, Chen AN, Su TL, Chang JK, Yang TH, Chen C, Cheng CI, Chen PC, Chen YL. Chen SM, et al. Front Cardiovasc Med. 2022 Apr 12;9:763217. doi: 10.3389/fcvm.2022.763217. eCollection 2022. Front Cardiovasc Med. 2022. PMID: 35498011 Free PMC article. - Vasculopathy and Coagulopathy Associated with SARS-CoV-2 Infection.
Labò N, Ohnuki H, Tosato G. Labò N, et al. Cells. 2020 Jun 30;9(7):1583. doi: 10.3390/cells9071583. Cells. 2020. PMID: 32629875 Free PMC article. Review.
References
- Nicholls MG, Richards AM, Agarwal M (1998) The importance of the renin-angiotensin system in cardiovascular disease. J Hum Hypertens 12: 295–299. - PubMed
- Ferrario CM (1990) The renin-angiotensin system: importance in physiology and pathology. J Cardiovasc Pharmacol 15 Suppl 3S1–5. - PubMed
- Donoghue M, Hsieh F, Baronas E, Godbout K, Gosselin M, et al. (2000) A novel angiotensin-converting enzyme-related carboxypeptidase (ACE2) converts angiotensin I to angiotensin 1–9. Circ Res 87: E1–9. - PubMed
- Zhong J, Basu R, Guo D, Chow FL, Byrns S, et al... (2010) Angiotensin-converting enzyme 2 suppresses pathological hypertrophy, myocardial fibrosis, and cardiac dysfunction. Circulation 122: 717–728, 718 p following 728. - PubMed
Publication types
MeSH terms
Substances
LinkOut - more resources
Full Text Sources
Other Literature Sources
Medical
Research Materials
Miscellaneous
