Structural basis for binding the TREX2 complex to nuclear pores, GAL1 localisation and mRNA export - PubMed (original) (raw)
Structural basis for binding the TREX2 complex to nuclear pores, GAL1 localisation and mRNA export
Divyang Jani et al. Nucleic Acids Res. 2014 Jun.
Abstract
The conserved Sac3:Thp1:Sem1:Sus1:Cdc31 (TREX2) complex binds to nuclear pore complexes (NPCs) and, in addition to integrating mRNA nuclear export with preceding steps in the gene expression pathway, facilitates re-positioning of highly regulated actively transcribing genes (such as GAL1) to NPCs. Although TREX2 is thought to bind NPC protein Nup1, defining the precise role of this interaction has been frustrated by the complex pleiotropic phenotype exhibited by nup1Δ strains. To provide a structural framework for understanding the binding of TREX2 to NPCs and its function in the gene expression pathway, we have determined the structure of the Nup1:TREX2 interaction interface and used this information to engineer a Sac3 variant that impairs NPC binding while not compromising TREX2 assembly. This variant inhibited the NPC association of both de-repressed and activated GAL1 and also produced mRNA export and growth defects. These results indicate that the TREX2:Nup1 interaction facilitates the efficient nuclear export of bulk mRNA together with the re-positioning of GAL1 to NPCs that is required for transcriptional control that is mediated by removal of SUMO from repressors by NPC-bound Ulp1.
© The Author(s) 2014. Published by Oxford University Press on behalf of Nucleic Acids Research.
Figures
Figure 1.
The structure of the Nup1:Sac3757–787:Sus1B complex. (A) Overview of the arrangement of the chains in the complex. (B) Schematic representation of the interactions formed between Nup1, Sac3 and Sus1B upon complex formation. Dashed lines represent putative hydrogen bonds or salt bridges. (C) Principal interacting residues in Sac3 (highlighted in red) and Sus1B (highlighted in dark cyan) that are buried in the interface with Nup1. (D) Electrostatic surface representation of Sac3 and Sus1B in the same view as in (C) showing the cavity to which Nup1 binds. Nup1 residues interacting with only Sus1 are shown in purple; those interacting with only Sac3 in green and those interacting with both are shown in yellow.
Figure 2.
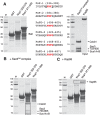
The binding of karyopherin Kap95 and the Sac3CID domain complex to FxF and FxFG motifs within Nup1. (A) GST, GST-Nup1322–370 and GST-Nup1371–500 were immobilised on Glutathione Sepharose resin as bait for pull-down assays with purified Kap95 and Sac3CID domain complex used as input. Full-length GST-Nup1 material is marked by an asterisk with the sequence of FxF and FxFG motifs present shown (motif core in red and numbering starting with the first Phe). (B, C) Bound material remaining after incubation, resin washing, SDS-PAGE and Coomassie staining is shown boxed. Whereas the Sac3CID domain complex bound only the FDFI motif, Kap95 bound only the FxFG motifs. M, molecular weight markers (kDa).
Figure 3.
Mutations in Sac3 that impair binding of the Sac3CID domain complex to Nup1 in vitro while not impacting on Sac3CID complex assembly impair Sac3 targeting to the nuclear periphery in vivo. (A) Assembly of mutant Sac3CID domain complexes were monitored by pull-down assays. Clarified bacterial lysates containing GST-Sac3753–805 wild-type (WT) or mutant derivatives co-expressed with Cdc31 were mixed with an excess of clarified bacterial lysate containing Sus1 and incubated with Glutathione Sepharose resin. Washed resins were analysed by SDS-PAGE and Coomassie staining. (B) Mutants were purified in a fragment of Sac3 encompassing residues 723–805 complexed to Sus1A, Sus1B and Cdc31 (the complete Sac3CID domain complex) and equimolar amounts of each were used as input in pull-down assays using GST-Nup1191–385 as bait immobilised on Glutathione Sepharose resin (C). Washed resins were analysed by SDS-PAGE and Coomassie staining and demonstrated that Nup1 bound only to WT complex (boxed). M; molecular weight markers (kDa). (D) Fluorescence micrographs of yeast strains in which the sole genomic copy of SAC3 carried a C-terminal mTurquoise2 tag and was either WT or mutated as indicated. The nuclear periphery was visualiszed by Nup49-GFP. NPC binding was most strongly impaired by sac3 L768A-H774D.
Figure 4.
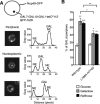
Inhibition of the Nup1:TREX2 interaction produces a defect in the relocation of the GAL gene cluster to the nuclear periphery under both de-repressed and activating conditions. (A) Schematic representation of a nucleus in which the GAL locus is labelled with a tetO array allowing visualisation with GFP-TetR and the nuclear periphery is marked by Nup49-GFP. Fluorescence micrographs of nuclei in which the GAL locus is positioned at the periphery or within the nucleoplasm and the corresponding plots of pixel intensity (gray value) versus distance (pixels). NE, nuclear envelope. (B) Percentage of cells in which the GAL locus is observed at the nuclear periphery with glucose, galactose and raffinose carbon sources for cells containing wild-type SAC3 and the L768A-H774D variant. Error bars represent standard error of the mean for three independent experiments in which at least 100 cells were scored in each. An unpaired, two-tailed Student's t test was used to determine statistical significance; *P < 0.05, **P < 0.01, ***P < 0.001. P values represent a comparison between % of cells in which the GAL locus is observed at the nuclear periphery in glucose with other carbon sources for wild-type and mutant backgrounds, or as indicated.
Figure 5.
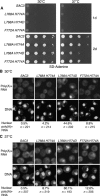
Inhibition of the Nup1:TREX2 interaction produces cellular growth and nuclear mRNA export defects. (A) Analysis of cellular growth by 10-fold serial dilution of indicated wild-type and sac3 mutant strains on SD–Adenine (2% glucose). (B,C) Fluorescence in situ hybridisation analysis of poly(A)+ RNA export in the indicated wild-type and sac3 mutant strains at 30 and 37°C. The number of cells analysed and the percentage showing nuclear poly(A)+ RNA is indicated. The sac3 L768A-H774D variant showed the most marked defects.
Figure 6.
Schematic illustration of the function of TREX2 binding to Nup1 in regulating GAL1. (A) When glucose is available as a carbon source, Mig1 results in GAL1 being repressed together with promoter-bound Ssn6 and Tup1, both of which are sumoylated. (B) Under either de-repressing (raffinose) or activating (galactose) conditions, the SUMO protease Ulp1, that is bound to NPCs, removes the SUMO moieties from Ssn6 and Tup1 relieving repression (19). The action of Nup1-bound TREX2 and chromatin-bound SAGA in retaining GAL1 at the NPC ensures that repression by Ssn6 and Tup1 is suppressed because of proximity to Ulp1. The proximity of GAL1 and other highly regulated actively transcribing genes to the NPC may facilitate the nuclear export of transcripts as well as facilitating transcriptional memory and promoting gene stability (1,3,4,7,8,9,10,11).
Similar articles
- Sus1, Cdc31, and the Sac3 CID region form a conserved interaction platform that promotes nuclear pore association and mRNA export.
Jani D, Lutz S, Marshall NJ, Fischer T, Köhler A, Ellisdon AM, Hurt E, Stewart M. Jani D, et al. Mol Cell. 2009 Mar 27;33(6):727-37. doi: 10.1016/j.molcel.2009.01.033. Mol Cell. 2009. PMID: 19328066 Free PMC article. - Getting to the gate: crystallization of a Sac3(CID):Sus1:Cdc31 complex.
Wilmes GM, Guthrie C. Wilmes GM, et al. Mol Cell. 2009 Mar 27;33(6):671-2. doi: 10.1016/j.molcel.2009.03.003. Mol Cell. 2009. PMID: 19328059 - Structural basis for the assembly and nucleic acid binding of the TREX-2 transcription-export complex.
Ellisdon AM, Dimitrova L, Hurt E, Stewart M. Ellisdon AM, et al. Nat Struct Mol Biol. 2012 Feb 19;19(3):328-36. doi: 10.1038/nsmb.2235. Nat Struct Mol Biol. 2012. PMID: 22343721 Free PMC article. - Structure and Function of the TREX-2 Complex.
Stewart M. Stewart M. Subcell Biochem. 2019;93:461-470. doi: 10.1007/978-3-030-28151-9_15. Subcell Biochem. 2019. PMID: 31939161 Review. - A novel family of nuclear transport receptors mediates the export of messenger RNA to the cytoplasm.
Izaurralde E. Izaurralde E. Eur J Cell Biol. 2002 Nov;81(11):577-84. doi: 10.1078/0171-9335-00273. Eur J Cell Biol. 2002. PMID: 12498157 Review.
Cited by
- GBPL3 localizes to the nuclear pore complex and functionally connects the nuclear basket with the nucleoskeleton in plants.
Tang Y, Ho MI, Kang BH, Gu Y. Tang Y, et al. PLoS Biol. 2022 Oct 21;20(10):e3001831. doi: 10.1371/journal.pbio.3001831. eCollection 2022 Oct. PLoS Biol. 2022. PMID: 36269771 Free PMC article. - Structural Characterization of the Chaetomium thermophilum TREX-2 Complex and its Interaction with the mRNA Nuclear Export Factor Mex67:Mtr2.
Dimitrova L, Valkov E, Aibara S, Flemming D, McLaughlin SH, Hurt E, Stewart M. Dimitrova L, et al. Structure. 2015 Jul 7;23(7):1246-57. doi: 10.1016/j.str.2015.05.002. Epub 2015 Jun 4. Structure. 2015. PMID: 26051714 Free PMC article. - Telomeric C-circles localize at nuclear pore complexes in Saccharomyces cerevisiae.
Aguilera P, Dubarry M, Hardy J, Lisby M, Simon MN, Géli V. Aguilera P, et al. EMBO J. 2022 Mar 15;41(6):e108736. doi: 10.15252/embj.2021108736. Epub 2022 Feb 11. EMBO J. 2022. PMID: 35147992 Free PMC article. - Integration of mRNP formation and export.
Björk P, Wieslander L. Björk P, et al. Cell Mol Life Sci. 2017 Aug;74(16):2875-2897. doi: 10.1007/s00018-017-2503-3. Epub 2017 Mar 17. Cell Mol Life Sci. 2017. PMID: 28314893 Free PMC article. Review. - Nucleoporin TPR is an integral component of the TREX-2 mRNA export pathway.
Aksenova V, Smith A, Lee H, Bhat P, Esnault C, Chen S, Iben J, Kaufhold R, Yau KC, Echeverria C, Fontoura B, Arnaoutov A, Dasso M. Aksenova V, et al. Nat Commun. 2020 Sep 11;11(1):4577. doi: 10.1038/s41467-020-18266-2. Nat Commun. 2020. PMID: 32917881 Free PMC article.
References
- Stewart M. Nuclear export of mRNA. Trends Biochem. Sci. 2010;35:609–617. - PubMed
- Rodriguez-Navarro S., Hurt E. Linking gene regulation to mRNA production and export. Curr. Opin. Cell Biol. 2011;23:302–309. - PubMed
- Aguilera A., García-Muse T. Causes of genome instability. Annu. Rev. Genet. 2013;47:1–32. - PubMed
- García-Oliver E., García-Molinero V., Rodríguez-Navarro S. mRNA export and gene expression: the SAGA-TREX2 connection. Biochim. Biophys. Acta. 2012;1819:555–565. - PubMed
Publication types
MeSH terms
Substances
LinkOut - more resources
Full Text Sources
Other Literature Sources
Molecular Biology Databases
Research Materials


