Protein aggregation can inhibit clathrin-mediated endocytosis by chaperone competition - PubMed (original) (raw)
Protein aggregation can inhibit clathrin-mediated endocytosis by chaperone competition
Anan Yu et al. Proc Natl Acad Sci U S A. 2014.
Abstract
Protein conformational diseases exhibit complex pathologies linked to numerous molecular defects. Aggregation of a disease-associated protein causes the misfolding and aggregation of other proteins, but how this interferes with diverse cellular pathways is unclear. Here, we show that aggregation of neurodegenerative disease-related proteins (polyglutamine, huntingtin, ataxin-1, and superoxide dismutase-1) inhibits clathrin-mediated endocytosis (CME) in mammalian cells by aggregate-driven sequestration of the major molecular chaperone heat shock cognate protein 70 (HSC70), which is required to drive multiple steps of CME. CME suppression was also phenocopied by HSC70 RNAi depletion and could be restored by conditionally increasing HSC70 abundance. Aggregation caused dysregulated AMPA receptor internalization and also inhibited CME in primary neurons expressing mutant huntingtin, showing direct relevance of our findings to the pathology in neurodegenerative diseases. We propose that aggregate-associated chaperone competition leads to both gain-of-function and loss-of-function phenotypes as chaperones become functionally depleted from multiple clients, leading to the decline of multiple cellular processes. The inherent properties of chaperones place them at risk, contributing to the complex pathologies of protein conformational diseases.
Keywords: HSP70; chaperone-dependent processes; protein misfolding; proteostasis.
Conflict of interest statement
The authors declare no conflict of interest.
Figures
Fig. 1.
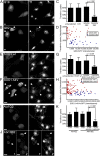
CME is reduced in cells with protein aggregates. Internalization of Alexa555-conjugated transferrin was assayed by fluorescence confocal microscopy in cells transiently (A_–_H) or stably (I_–_K) expressing various aggregation-prone proteins fused to GFP. (A and B) Internalized Alexa555-transferrin (Tf, Right) in human PC-3 cells transiently expressing soluble or aggregation-prone Q19-EGFP or Q82-EGFP, respectively (Left). Images shown are maximal projections of a z-series of fluorescence confocal slices through the entire cell volume. Arrows indicate cells containing aggregates. Note the aggregate-containing cells in B have reduced fluorescence levels of transferrin compared with untransfected or soluble Q82-expressing cells. (Scale bar, 10 μm.) (C) Quantification of the effect of relative Q82 expression levels, as measured by sum fluorescence intensities of EGFP divided by the cell area, on transferrin internalization. Quantification for each cell was measured by taking the sum fluorescence intensity of the z-series through the total cell volume, divided by the area of the cell. Shown are the mean values, with error bars representing SDs. P values were determined using a Student t test. (D) Scatterplot depicts quantification of internalized Alexa555-transferrin in untransfected and Q19-EGFP–, or Q82-EGFP–expressing cells. (E and F) As in A and B, but in PC-3 cells expressing WT (wt) or aggregation-prone mutant (A4V) SOD1-AcGFP, respectively. Arrows indicate cells containing aggregates. The cell labeled with an asterisk contains minute aggregates and is further magnified in
Fig. S1_E_
. (G) Quantification, as in C, of internalized transferrin in SOD1-expressing cells. (H) Effect of relative expression levels on transferrin uptake, as in D, in SOD1(A4V)-expressing cells. (I and J) As in A and B, but in Neuro2a cells induced to express stably a single integrated copy of EGFP-fused Q2- or Q82-expanded Atx-1. (J) Two separate image samples are shown for GFP (1, 2) and transferrin (1′, 2′) fluorescence. Arrows indicate cells containing aggregates. (K) Quantification, as in C, of internalized transferrin in Neuro2a cells induced to express Atx-1 Q2 or Q82. Dox, doxycycline.
Fig. 2.
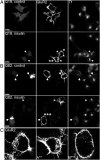
Depletion of HSC70 by protein aggregate relocalization or by RNAi inhibits CME. (A) PC-3 cells transiently expressing Q82-EGFP (Left) were assayed for internalized Alexa555-transferrin (Right) and endogenous HSC70 localization (Center). HSC70 was detected using specific antibodies by indirect immunofluorescence. Arrows point to an aggregate-containing cells. Note that the diffuse pool of HSC70 appears reduced in this cell. (Scale bar, 10 μm.) (B) As in A, but in PC-3 cells expressing mutant SOD1 (A4V)-AcGFP. Arrows point to an aggregate-containing cells. (C) As in A, but in PC-3 cells expressing EGFP-Atx-1 Q82. Arrows point to an aggregate-containing cells. Neuro2a cells transfected with control (D) or specific siRNAs targeting HSC70 (E) were assayed for Alexa555-transferrin internalization (Right) and immunostained for endogenous HSC70 (Left). Note the decreased levels of HSC70 and corresponding low transferrin levels in E. (F) Quantification of internalized transferrin levels in Neuro2a cells that were untransfected or transfected with control or HSC70 siRNA oligonucleotides. Shown are the relative HSC70 expression level values of individual cells plotted against their corresponding internalized transferrin fluorescence values as calculated in G. The plot background has been divided into three sections based on relative HSC70 levels normalized to the average of the control siRNA cells (yellow, <50%; pink, 50–100%; and blue, >100%) to show the number of cells that fall into each category. The three binned categories are those depicted in G. (G) Quantification of internalized transferrin levels in Neuro2a cells that were untransfected or treated with control or HSC70 siRNA oligonucleotides. Cells were grouped into three categories based on relative HSC70 expression levels and normalized to that of control siRNA transfected cells. Internalized transferrin fluorescence was analyzed as in Fig. 1. Shown are mean values of transferrin levels with error bars representing SDs. P values were determined using a Student t test.
Fig. 3.
Increasing HSC70 in a concentration-dependent manner rescues CME defects in protein aggregate-containing cells. (A) Schematic of Dox-induced E2-Crimson HSC70 expression relative to Q82 transfection. (B and C) Neuro2a cells containing a Dox-inducible, single integrated copy of E2-Crimson HSC70 were transiently transfected to express Q82-EGFP. Note that the cells containing Q82 aggregates (Left) without induction of E2-Crimson HSC70 (B, Right) show decreased levels of Alexa555-transferrin (Center), compared with cells where E2-Crimson HSC70 has been induced (C, Right). Arrows indicate cells with aggregates. (Scale bar, 10 μm.) (D) Quantification of internalized transferrin fluorescence in Neuro2a cells expressing induced E2-Crimson HSC70 for the indicated time periods. (E) Relative protein levels of induced E2-Crimson fused and endogenous HSC70 at different time points were detected by immunoblotting with specific antibodies recognizing both HSC70 and HSP70. The combined levels of endogenous and E2-Crimson HSC70 were quantified for each induced time point compared with control nontreated cells cultured for the same time period.
Fig. 4.
Simultaneous inhibition of transferrin and AMPA receptor endocytosis in aggregate-containing cells. (A) Neuro2a cells were cotransfected with plasmids encoding both HA-GluR2 and Q19-EGFP for 48 h. (Left) Cells expressing Q19-EGFP were labeled with anti-HA antibody for AMPA receptor at the cell surface. Cells were then treated without (Upper) or with (Lower) 3 μM insulin for 15 min, and followed by transferrin uptake for another 15 min (Right). (Center) Localization of anti-HA antibody was probed through immunofluorescence. Arrowheads point to Q19-expressing cells. (B, Left) As in A, but transiently expressing Q82-EGFP. The arrows point to an aggregate-containing cell. Note that whereas cells without protein aggregates showed a normal rate of transferrin uptake and GluR2 internalization (arrowheads), the cells with aggregates showed defects in both processes (arrows). (Scale bar, 10 μm.) (C) Enlarged images show cells labeled with asterisks in A and B.
Fig. 5.
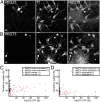
HSC70 recruitment to HttQ73 aggregates in primary CNS neurons is accompanied by inhibition of CME. Primary corticostriatal neuronal cocultures were nucleofected to express either Htt exon 1 Q23-CFP (A) or Htt exon 1 Q73-CFP (B), assayed for Alexa555-transferrin internalization, and immunostained for endogenous HSC70 localization. Images shown are maximal projections of a z-series of fluorescence confocal slices through the entire cell volume. In B, note that HSC70 colocalizes with Htt Q73 aggregates (arrows) and that neurons expressing these aggregates show reduced levels of transferrin uptake. Arrowheads and arrows point to neurons expressing HttQ23 or aggregated HttQ73 in A and B, respectively. (Scale bar, 10 μm.) (C) Scatterplot of fluorescence quantification of internalized transferrin as related to Htt exon 1 Q23-CFP levels, as in Fig. 1_D_, in individual primary neurons. Neurons were grouped into nonexpressing vs. expressing categories. Both transferrin and CFP fluorescence were normalized to the highest values of the no expression control and CFP-expressing cells, respectively, and data from two imaging trials (labeled as 1 and 2) of the same sample were plotted. (D) As in C, except for neurons expressing Htt exon 1 Q73-CFP. Neurons were grouped into nonexpressing/low soluble expression vs. aggregated categories.
Fig. 6.
Model depicts chaperone competition between protein aggregates and the CME pathway. (A) Under normal conditions, HSC70 is at sufficiently high levels to mediate CME, as well as basal protein client folding. (B) Under disease conditions, where protein aggregates have accumulated and cytosolic HSC70 levels have been titrated, CME is inhibited, but this inhibition can be restored by increasing chaperone levels.
Similar articles
- Tau protein aggregates inhibit the protein-folding and vesicular trafficking arms of the cellular proteostasis network.
Yu A, Fox SG, Cavallini A, Kerridge C, O'Neill MJ, Wolak J, Bose S, Morimoto RI. Yu A, et al. J Biol Chem. 2019 May 10;294(19):7917-7930. doi: 10.1074/jbc.RA119.007527. Epub 2019 Apr 1. J Biol Chem. 2019. PMID: 30936201 Free PMC article. - Multiple roles of auxilin and hsc70 in clathrin-mediated endocytosis.
Eisenberg E, Greene LE. Eisenberg E, et al. Traffic. 2007 Jun;8(6):640-6. doi: 10.1111/j.1600-0854.2007.00568.x. Epub 2007 May 4. Traffic. 2007. PMID: 17488288 Review. - Chaperone suppression of cellular toxicity of huntingtin is independent of polyglutamine aggregation.
Zhou H, Li SH, Li XJ. Zhou H, et al. J Biol Chem. 2001 Dec 21;276(51):48417-24. doi: 10.1074/jbc.M104140200. Epub 2001 Oct 17. J Biol Chem. 2001. PMID: 11606565 - Hsc70 chaperones clathrin and primes it to interact with vesicle membranes.
Jiang R, Gao B, Prasad K, Greene LE, Eisenberg E. Jiang R, et al. J Biol Chem. 2000 Mar 24;275(12):8439-47. doi: 10.1074/jbc.275.12.8439. J Biol Chem. 2000. PMID: 10722678 - Molecular chaperones and the regulation of neurotransmitter exocytosis.
Zinsmaier KE, Bronk P. Zinsmaier KE, et al. Biochem Pharmacol. 2001 Jul 1;62(1):1-11. doi: 10.1016/s0006-2952(01)00648-7. Biochem Pharmacol. 2001. PMID: 11377391 Review.
Cited by
- SOD1 aggregation in ALS mice shows simplistic test tube behavior.
Lang L, Zetterström P, Brännström T, Marklund SL, Danielsson J, Oliveberg M. Lang L, et al. Proc Natl Acad Sci U S A. 2015 Aug 11;112(32):9878-83. doi: 10.1073/pnas.1503328112. Epub 2015 Jul 28. Proc Natl Acad Sci U S A. 2015. PMID: 26221023 Free PMC article. - Mutant huntingtin confers cell-autonomous phenotypes on Huntington's disease iPSC-derived microglia.
Stöberl N, Donaldson J, Binda CS, McAllister B, Hall-Roberts H, Jones L, Massey TH, Allen ND. Stöberl N, et al. Sci Rep. 2023 Nov 22;13(1):20477. doi: 10.1038/s41598-023-46852-z. Sci Rep. 2023. PMID: 37993517 Free PMC article. - Regulation of germline proteostasis by HSF1 and insulin/IGF-1 signaling.
Muhammad T, Li J. Muhammad T, et al. Biochem Soc Trans. 2023 Apr 26;51(2):501-512. doi: 10.1042/BST20220616. Biochem Soc Trans. 2023. PMID: 36892215 Free PMC article. - Effects of maturation on the conformational free-energy landscape of SOD1.
Culik RM, Sekhar A, Nagesh J, Deol H, Rumfeldt JAO, Meiering EM, Kay LE. Culik RM, et al. Proc Natl Acad Sci U S A. 2018 Mar 13;115(11):E2546-E2555. doi: 10.1073/pnas.1721022115. Epub 2018 Feb 26. Proc Natl Acad Sci U S A. 2018. PMID: 29483249 Free PMC article. - Functional Modules of the Proteostasis Network.
Jayaraj GG, Hipp MS, Hartl FU. Jayaraj GG, et al. Cold Spring Harb Perspect Biol. 2020 Jan 2;12(1):a033951. doi: 10.1101/cshperspect.a033951. Cold Spring Harb Perspect Biol. 2020. PMID: 30833457 Free PMC article. Review.
References
- Chartier-Harlin MC, et al. Early-onset Alzheimer’s disease caused by mutations at codon 717 of the beta-amyloid precursor protein gene. Nature. 1991;353(6347):844–846. - PubMed
- Bruijn LI, et al. ALS-linked SOD1 mutant G85R mediates damage to astrocytes and promotes rapidly progressive disease with SOD1-containing inclusions. Neuron. 1997;18(2):327–338. - PubMed
- Davies SW, et al. Formation of neuronal intranuclear inclusions underlies the neurological dysfunction in mice transgenic for the HD mutation. Cell. 1997;90(3):537–548. - PubMed
- DiFiglia M, et al. Aggregation of huntingtin in neuronal intranuclear inclusions and dystrophic neurites in brain. Science. 1997;277(5334):1990–1993. - PubMed
- Skinner PJ, et al. Ataxin-1 with an expanded glutamine tract alters nuclear matrix-associated structures. Nature. 1997;389(6654):971–974. - PubMed
Publication types
MeSH terms
Substances
Grants and funding
- R01 NS047331/NS/NINDS NIH HHS/United States
- R37 GM038109/GM/NIGMS NIH HHS/United States
- NS047331/NS/NINDS NIH HHS/United States
- NS080514/NS/NINDS NIH HHS/United States
- R01 GM038109/GM/NIGMS NIH HHS/United States
- GM081192/GM/NIGMS NIH HHS/United States
- DRG 2086-11/HHMI/Howard Hughes Medical Institute/United States
- AG026647/AG/NIA NIH HHS/United States
- R01 AG026647/AG/NIA NIH HHS/United States
- GM038109/GM/NIGMS NIH HHS/United States
- R21 NS080514/NS/NINDS NIH HHS/United States
- R37 AG026647/AG/NIA NIH HHS/United States
LinkOut - more resources
Full Text Sources
Other Literature Sources
Molecular Biology Databases
Research Materials
Miscellaneous


