Dynamin 2 along with microRNA-199a reciprocally regulate hypoxia-inducible factors and ovarian cancer metastasis - PubMed (original) (raw)
. 2014 Apr 8;111(14):5331-6.
doi: 10.1073/pnas.1317242111. Epub 2014 Mar 24.
Indira V Subramanian, Erica K Schnettler, Goutam Ghosh, Rajesha Rupaimoole, Colleen Evans, Manju Saluja, Yawu Jing, Ivan Cristina, Sabita Roy, Yan Zeng, Vijay H Shah, Anil K Sood, Sundaram Ramakrishnan
Affiliations
- PMID: 24706848
- PMCID: PMC3986124
- DOI: 10.1073/pnas.1317242111
Dynamin 2 along with microRNA-199a reciprocally regulate hypoxia-inducible factors and ovarian cancer metastasis
Hemant P Joshi et al. Proc Natl Acad Sci U S A. 2014.
Abstract
Hypoxia-driven changes in the tumor microenvironment facilitate cancer metastasis. In the present study, we investigated the regulatory cross talk between endocytic pathway, hypoxia, and tumor metastasis. Dynamin 2 (DNM2), a GTPase, is a critical mediator of endocytosis. Hypoxia decreased the levels of DNM2. DNM2 promoter has multiple hypoxia-inducible factor (HIF)-binding sites and genetic deletion of them relieved hypoxia-induced transcriptional suppression. Interestingly, DNM2 reciprocally regulated HIF. Inhibition of DNM2 GTPase activity and dominant-negative mutant of DNM2 showed a functional role for DNM2 in regulating HIF. Furthermore, the opposite strand of DNM2 gene encodes miR-199a, which is similarly reduced in cancer cells under hypoxia. miR-199a targets the 3'-UTR of HIF-1α and HIF-2α. Decreased miR-199a expression in hypoxia increased HIF levels. Exogenous expression of miR-199a decreased HIF, cell migration, and metastasis of ovarian cancer cells. miR-199a-mediated changes in HIF levels affected expression of the matrix-remodeling enzyme, lysyloxidase (LOX). LOX levels negatively correlated with progression-free survival in ovarian cancer patients. These results demonstrate a regulatory relationship between DNM2, miR-199a, and HIF, with implications in cancer metastasis.
Keywords: iron regulation; microRNA.
Conflict of interest statement
The authors declare no conflict of interest.
Figures
Fig. 1.
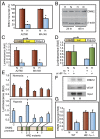
DNM2 is down-regulated in hypoxia in EOCC. (A) DNM2 transcript levels [quantitative PCR (qPCR)] in normoxia (N) or hypoxia (H) are shown. (B) Western blot of DNM2. (C) (Upper) DNM2 promoter (−1,000)-luciferase reporter construct. (Lower) DNM2 promoter-luciferase expression in normoxia (N) or hypoxia (H). (D) HIF-1α knockdown by siRNA rescues DNM2 promoter activity. (E) HRE sites 1 through 5 in DNM2 promoter were deleted individually. Relative changes in DNM2 promoter activity were determined by luciferase activity. (F) ChIP analyses show HIF-1 binding to HRE sites 1–3 in DNM2 promoter. HIF-1 binding to VEGFA promoter was used as a positive control. (G) MEFs from wild-type (WT) and knockout (HIF-1α−/−) mice were grown either in normoxia (N) or hypoxia (H). DNM2 transcript levels were determined by qPCR. Transcript levels in normoxia were considered as 1.0. Values represent mean of transcript levels from three independent cultures.
Fig. 2.
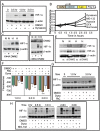
Reciprocal relationship between DNM and HIF-1α. (A) Inhibition of Dynamin rapidly stabilizes HIF-1α. Representative Western blot of HIF-1α is shown. (B) Dynamin inhibition increases ODDD-HIF-1α-luc fusion protein. (C) Dominant-negative DNM (K44A-DNM2) rescued DNM-mediated down-regulation of HIF-1α in hypoxia. Western blot for HIF-1α is shown. Normoxia (N; lanes 1 and 2), hypoxia (H; lanes 3 and 4). (D) DNM2 overexpression inhibits HIF-1α. (E) DNM2 knockdown increases HIF-1α and HIF-2 α levels (representative Western blot). (F) Iron levels were indirectly measured by quenching of calcein-AM fluorescence. (G) Stabilization of HIF-1α by Dynamin inhibition is reversed by FAC treatment (representative Western blot). (H) Dynamin inhibition blocks polyubiquitination of HIF-1α. Proteasome inhibitor, MG132, was used to block degradation of HIF-1α. Dyna, Dynasore; Sc, scrambled control.
Fig. 3.
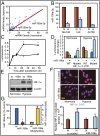
Overexpression of miR-199a targets HIF1α. (A) Custom micro-RNA array was used to determine changes in miR expression. (B) miR-199a-5p levels (qPCR) in normoxia (N) or hypoxia (H). Values represent mean ± SD from three independent experiments. *P < 0.05. (C) Luciferase- HIF-1α 3′-UTR (Luc-HIF-1α 3′-UTR) was used as reporter in normoxia (❍) or hypoxia (•). (D) Luc-HIF1α 3′-UTR and mutant HIF-1α 3′-UTR (seed sequence deletion) were used to determine miR-199a targeting. (E) Western blot shows inhibition of HIF-1α levels by miR-199a duplex. (F) Confocal images of HIF-1α nuclear translocation. HIF-1α (red) and nuclei (DAPI; blue). (Scale bar: 10 μm.) Histogram shows mean density of red pixel (HIF-1α)/nuclei. (G) Relative levels of miR-199a-5p (Left) and HIF-1α transcript (Right) in A2780 cells after treatment with control morpholino or miR-199a–specific morpholinos. Values represent mean ± SD from three independent determinations. *P < 0.05. **P < 0.001.
Fig. 4.
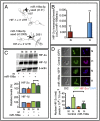
Effect of miR-199a on HIF-2α. (A) RNA-fold secondary structure prediction analyses of HIF-1α and HIF-2α 3′-UTR. (B) Transfection of miR-199a decreased HIF-2α transcript levels as determined by qPCR. Data show ΔΔCt values comparing transcript levels between miR-199a–transfected and control duplex (sc) transfected cells. Values represent three independent transfections. (C) Representative Western blots of HIF-2α and HIF-1β of control and miR-199a duplex transfected cells are shown. (D) Confocal images show hypoxia-induced nuclear translocation of HIF-2α was inhibited by miR-199a. A2780 cells were infected with a lentivirus construct to express either GFP alone or coexpress miR-199a and GFP. Histogram shows quantification of red pixel (HIF-2α) localized to 10 μm2 of nuclei. (Scale bars: 10 μm.)
Fig. 5.
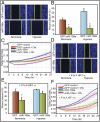
miR-199a stably expressed in EOCC suppresses cell migration in vitro. (A) Representative images of scratch/wound assays of A2780 cells expressing GFP or miR-199a/GFP lentivirus are shown. The green lines indicate wound edge (migration). (B) Migration distances were measured from six wells per group, and the average percentage of wound closure was calculated. (C) Real-time migration of A2780 cells expressing GFP or miR-199a/GFP in the presence and absence of hypoxia mimetic DFX. Delta cell index indicates electrical impedance measurements. (D) miR-199a effects on cell migration were mitigated by overexpressing nondegradable form of HIF-1α lacking 3′-UTR. Cells transfected with P-to-A HIF-1α, exposed to normoxia or hypoxia, are shown. (E) Quantification of scratch/wound assay described in D. (F) Real-time migration of A2780 GFP or miR-199a/GFP cells transfected with P-to-A HIF-1α. Values represent mean ± SD. *P < 0.05.
Fig. 6.
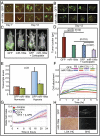
miR-199a inhibits peritoneal seeding and tumor burden. (A) Representative images of female athymic mice injected intraperitoneally (i.p.) with A2780 GFP or miR-199a/GFP are shown. (B) The yellow arrows show tumor seeding, and the blue arrows show GI metastases. (C) Representative images of tumor burden. (D) Wet weight of tumors. Values represent mean ± SD. P values are shown in parentheses. (E) LOX transcript levels were determined by qPCR. Each value is a mean of three independent experiments (*P < 0.05). (F) Real-time cell attachment to ECM components was measured by electrical impedance (cell index). C, control; COL I, collagen type 1; FB, fibronectin; LMN, laminin. (G) Effect of LOX inhibitor, β-aminopropionitrile (β-APN) on Transwell migration of cells. DFX, desferrioxamine, 100 μM. (H) Control and miR-199a–expressing A2780 tumor sections were stained for LOX [immunohistochemistry (IHC)] and second harmonic generation (SHG) to evaluate collagen deposition. Representative images are shown.
Fig. 7.
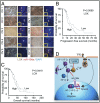
miR-199a expression in tissue samples from EOC patients and LOX expression. (A) Representative images of LOX expression and miR-199a in EOC. LOX staining (brown; lanes 1 and 3) and miR-199a in situ hybridization (red; lanes 2 and 4). The arrows indicate areas of miR-199a in situ hybridization. S, stroma; T, tumor. (Inset) Magnified area showing hybridization signal. (B) Kaplan–Meier plot of EOC patient TCGA data correlating LOX expression to progression-free survival (solid line, high LOX) (dashed line, low LOX). (C) Overall survival of ovarian cancer patients as related to LOX expression. (D) Schematic diagram showing reciprocal regulation of endocytic pathway (DNM) and HIF through miR-199a.
Similar articles
- MicroRNA-138 suppresses ovarian cancer cell invasion and metastasis by targeting SOX4 and HIF-1α.
Yeh YM, Chuang CM, Chao KC, Wang LH. Yeh YM, et al. Int J Cancer. 2013 Aug 15;133(4):867-78. doi: 10.1002/ijc.28086. Epub 2013 Mar 9. Int J Cancer. 2013. PMID: 23389731 - Roles and mechanism of miR-199a and miR-125b in tumor angiogenesis.
He J, Jing Y, Li W, Qian X, Xu Q, Li FS, Liu LZ, Jiang BH, Jiang Y. He J, et al. PLoS One. 2013;8(2):e56647. doi: 10.1371/journal.pone.0056647. Epub 2013 Feb 20. PLoS One. 2013. PMID: 23437196 Free PMC article. - Hypoxia inducible factor 1α-mediated LOX expression correlates with migration and invasion in epithelial ovarian cancer.
Ji F, Wang Y, Qiu L, Li S, Zhu J, Liang Z, Wan Y, Di W. Ji F, et al. Int J Oncol. 2013 May;42(5):1578-88. doi: 10.3892/ijo.2013.1878. Epub 2013 Mar 29. Int J Oncol. 2013. PMID: 23545606 Free PMC article. - A review of Dynamin 2 involvement in cancers highlights a promising therapeutic target.
Trochet D, Bitoun M. Trochet D, et al. J Exp Clin Cancer Res. 2021 Jul 22;40(1):238. doi: 10.1186/s13046-021-02045-y. J Exp Clin Cancer Res. 2021. PMID: 34294140 Free PMC article. Review. - Impact of Hypoxia-Induced miR-210 on Pancreatic Cancer.
Lian M, Mortoglou M, Uysal-Onganer P. Lian M, et al. Curr Issues Mol Biol. 2023 Dec 5;45(12):9778-9792. doi: 10.3390/cimb45120611. Curr Issues Mol Biol. 2023. PMID: 38132457 Free PMC article. Review.
Cited by
- MicroRNAs in gynecological cancers: Small molecules with big implications.
Srivastava SK, Ahmad A, Zubair H, Miree O, Singh S, Rocconi RP, Scalici J, Singh AP. Srivastava SK, et al. Cancer Lett. 2017 Oct 28;407:123-138. doi: 10.1016/j.canlet.2017.05.011. Epub 2017 May 24. Cancer Lett. 2017. PMID: 28549791 Free PMC article. Review. - microRNA-199a-5p regulates epithelial-to-mesenchymal transition in diabetic cataract by targeting SP1 gene.
Liu X, Gong Q, Yang L, Liu M, Niu L, Wang L. Liu X, et al. Mol Med. 2020 Dec 4;26(1):122. doi: 10.1186/s10020-020-00250-7. Mol Med. 2020. PMID: 33276722 Free PMC article. - Dynamin 2 Is Correlated with Recurrence and Poor Prognosis of Papillary Thyroid Cancer.
Ren N, Tian Z, Sun H, Lu X. Ren N, et al. Med Sci Monit. 2020 Aug 22;26:e924590. doi: 10.12659/MSM.924590. Med Sci Monit. 2020. PMID: 32827429 Free PMC article. - Reciprocal regulations between miRNAs and HIF-1α in human cancers.
Yang W, Ma J, Zhou W, Cao B, Zhou X, Zhang H, Zhao Q, Hong L, Fan D. Yang W, et al. Cell Mol Life Sci. 2019 Feb;76(3):453-471. doi: 10.1007/s00018-018-2941-6. Epub 2018 Oct 13. Cell Mol Life Sci. 2019. PMID: 30317527 Free PMC article. Review. - The interplay between HIF-1α and noncoding RNAs in cancer.
Peng X, Gao H, Xu R, Wang H, Mei J, Liu C. Peng X, et al. J Exp Clin Cancer Res. 2020 Feb 3;39(1):27. doi: 10.1186/s13046-020-1535-y. J Exp Clin Cancer Res. 2020. PMID: 32014012 Free PMC article. Review.
References
- Jemal A, et al. Cancer statistics, 2007. CA Cancer J Clin. 2007;57(1):43–66. - PubMed
- Kim KS, et al. Hypoxia enhances lysophosphatidic acid responsiveness in ovarian cancer cells and lysophosphatidic acid induces ovarian tumor metastasis in vivo. Cancer Res. 2006;66(16):7983–7990. - PubMed
- Mosesson Y, Mills GB, Yarden Y. Derailed endocytosis: An emerging feature of cancer. Nat Rev Cancer. 2008;8(11):835–850. - PubMed
- Wang Y, et al. Regulation of endocytosis via the oxygen-sensing pathway. Nat Med. 2009;15(3):319–324. - PubMed
Publication types
MeSH terms
Substances
Grants and funding
- R01 DA031201/DA/NIDA NIH HHS/United States
- T32DA007097/DA/NIDA NIH HHS/United States
- R01 DA031202/DA/NIDA NIH HHS/United States
- T32 DA007097/DA/NIDA NIH HHS/United States
- U54 CA151668/CA/NCI NIH HHS/United States
- P30 CA015083/CA/NCI NIH HHS/United States
- R01 CA114340/CA/NCI NIH HHS/United States
- K05 DA033881/DA/NIDA NIH HHS/United States
- R01 DA037843/DA/NIDA NIH HHS/United States
- R01 DA034582/DA/NIDA NIH HHS/United States
- DA031201/DA/NIDA NIH HHS/United States
- CA114340/CA/NCI NIH HHS/United States
LinkOut - more resources
Full Text Sources
Other Literature Sources
Medical
Molecular Biology Databases
Research Materials
