Ultra-sensitive liquid biopsy of circulating extracellular vesicles using ExoScreen - PubMed (original) (raw)
Nobuyoshi Kosaka 2, Yuki Konishi 3, Hideki Ohta 4, Hiroyuki Okamoto 4, Hikaru Sonoda 4, Ryoji Nonaka 5, Hirofumi Yamamoto 5, Hideshi Ishii 6, Masaki Mori 5, Koh Furuta 7, Takeshi Nakajima 8, Hiroshi Hayashi 9, Hajime Sugisaki 9, Hiroko Higashimoto 9, Takashi Kato 10, Fumitaka Takeshita 2, Takahiro Ochiya 2
Affiliations
- PMID: 24710016
- PMCID: PMC3988821
- DOI: 10.1038/ncomms4591
Free PMC article
Ultra-sensitive liquid biopsy of circulating extracellular vesicles using ExoScreen
Yusuke Yoshioka et al. Nat Commun. 2014.
Free PMC article
Abstract
Cancer cells secrete small membranous extracellular vesicles (EVs) into their microenvironment and circulation. Although their potential as cancer biomarkers has been promising, the identification and quantification of EVs in clinical samples remains challenging. Here we describe a sensitive and rapid analytical technique for profiling circulating EVs directly from blood samples of patients with colorectal cancer. EVs are captured by two types of antibodies and are detected by photosensitizer-beads, which enables us to detect cancer-derived EVs without a purification step. We also show that circulating EVs can be used for detection of colorectal cancer using the antigen CD147, which is embedded in cancer-linked EVs. This work describes a new liquid biopsy technique to sensitively detect disease-specific circulating EVs and provides perspectives in translational medicine from the standpoint of diagnosis and therapy.
Figures
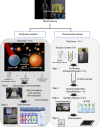
Figure 1. Schematic overview depicting the method for detecting circulating EVs via conventional methods and ExoScreen.
In the case of conventional methods, nearly 12 h are needed to detect the expression of certain protein in circulating EVs. In addition, excessive volumes of serum are required. Conversely, ExoScreen is completed within 2 h and requires only 5 μl of serum. In this system, streptavidin-coated donor beads capture an analyte-specific biotinylated antibody and are used in conjunction with acceptor beads conjugated to a second antibody. The streptavidin-coated donor beads are excited with a laser at 680 nm, resulting in the release of singlet oxygen, which excites an amplified fluorescent signal in the acceptor bead that emits at 615 nm when the beads are within 200 nm of the captured analyte.
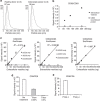
Figure 2. Establishment of ExoScreen to detect the EVs.
(a) Analysis of the size distribution in the serum of healthy donors (_n_=3) and colorectal cancer patients (_n_=3) by the NanoSight nanoparticle tracking system. (b) Detection of EVs or monomeric recombinant CD63 protein by ExoScreen using a CD63 antibody. EV protein concentration was measured via the Qubit system. The concentration of recombinant CD63 was adjusted with that of protein in EVs purified from HCT116 CM. Error bars are s.e.m. (_n_=3 for each condition). (c) Correlation between ExoScreen measurements for CD9 positive EVs, CD63 positive EVs or CD63/CD9 double-positive EVs and EV protein concentration in a dilution series. EV protein concentration was measured via the Qubit system. EVs were purified from HCT116 cell CM. The addition of biotinylated CD9 or CD63 antibodies without acceptor beads conjugated to antibodies is denoted ‘bCD9 only’ or ‘bCD63 only’, while ‘aCD9 only’ or ‘aCD63 only’ means addition of only acceptor beads conjugated to CD9 or CD63 antibodies without biotinylated antibodies. The addition of biotinylated antibodies and acceptor beads conjugated antibodies is denoted ‘bCD9/aCD9’ or ‘bCD63/aCD63’. Right panel shows the addition of biotinylated CD63 antibodies and acceptor beads conjugated CD9 antibodies. Error bars are s.e.m. (_n_=3 for each condition). (d) Evaluation of ExoScreen specificity against purified EVs from HCT116 cell treated with or without 0.05% and 0.5% Triton X-100. Two hundred fifty ng of EVs were detected by ExoScreen using CD9 antibodies. Error bars are s.e.m. (_n_=3 for each condition). (e) Evaluation of ExoScreen specificity against EVs from HCT116 cells treated with (Prok(+)) or without (Prok(−)) Proteinase K. Two hundred fifty ng of EVs were detected by ExoScreen using CD9 antibodies. Error bars are s.e.m. (_n_=3 for each condition). Data are representative of at least three independent experiments each.
Figure 3. Comparison of ExoScreen and conventional methods.
(a) Immunoblotting analysis of CD63 (upper panels) or CD9 (lower panels) against the EVs isolated from HCT116 cells. EV protein concentration were measured via the Qubit system. EVs were purified from HCT116 cell CM. (b) Correlation between ExoScreen measurements for CD9 positive, CD63 positive or CD63/CD9 double-positive EVs and HCT116 cell CM in a dilution series. CM was prepared for 5 μl and diluted as indicated. Error bars are s.e.m. (_n_=3 for each condition). (c) Correlation between ELISA measurements for CD9 positive EVs and EV protein concentration in a dilution series. EV protein concentration were measured via the Qubit system. EVs were purified from HCT116 cell CM. Error bars are s.e.m. (_n_=3 for each condition). Data are representative of at least three independent experiments each.
Figure 4. Detection of circulating EVs in healthy donor sera.
(a) Correlation between ExoScreen measurements for CD9 or CD63 and serum volume in a dilution series with (+) or without (−) Dextran-500. The final concentration of Dextran-500 was 1 mg ml−1. (b) Concentration of ‘1’ means the original concentration of donor and acceptor beads which we used in this study (see Methods section). In addition to original concentration, increased (twofold and fivefold) and decreased (0.5-fold and 0.25-fold) amount of donor and acceptor beads were evaluated by ExoScreen using serum from four healthy donors. Data are representative of at least three independent experiments each.
Figure 5. Analysis of the amount of CD147 in EVs derived from various colon cancer cell lines and a normal colon fibroblast cell line.
(a) Immunoblotting analysis of CD147 or CD9 against purified EVs isolated from CCD-18Co cells, HCT116 cells, HCT15 cells, HT29 cells, WiDr cells, COLO201 cells, COLO205 cells and SW1116 cells. EV proteins (250 ng) was used for the detection of CD147 and CD9. (b) Correlation between ExoScreen detection of CD147/CD9 double-positive EVs and EV protein concentration in a dilution series. EVs protein concentration was measured via the Qubit system. EVs were purified from CCD-18Co, HCT116, HCT15, HT29, WiDr, COLO201, COLO205 or SW1116 CM. Error bars are s.e.m. (_n_=3 for each condition). Data are representative of at least three independent experiments each.
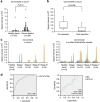
Figure 6. Analysis of circulating CD147 and CD9 double-positive EVs in healthy donors or colorectal cancer patient sera.
(a) Serum levels of CD147/CD9 double-positive EVs in colorectal cancer patients without any purification. The panel shows a scatter plot for healthy donors (_n_=191) and colorectal cancer patients (_n_=194). The _P_-value was calculated by using Wilcoxon rank-sum test. (b) Changes in serum levels of CD147/CD9 double-positive EVs in colorectal cancer patients (stage I or II: _n_=15) before (preoperation) and after (postoperation after 7–34 days) surgical removal of the tumor. Box lengths represent the interquartile range (first to third quartiles). The line in the center of the boxes represents the median value. Data represented by the asterisks are extreme values (greater than three times the interquartile range over the third quartile). The _P_-value was calculated by using Wilcoxon signed-rank test. (c) The results of ExoScreen detection of circulating EVs (left panel) and purified circulating EVs (right panel) in sera from healthy donors (_n_=10) and colorectal cancer patients (_n_=35) using CD147 and CD9 antibodies. The panels show the signal intensities from each samples measured for CD147/CD9 double-positive EVs using ExoScreen. (d) Receiver operating characteristic curves between healthy donors and colorectal cancer patients assesing by CD147/CD9 double-positive EVs (left panel), CEA and CA19-9 (right panel). left panel, CD147/CD9 double-positive EVs (healthy donors versus colorectal cancer patients; AUC: 0.820); right panel, CEA (AUC: 0.669); CA19-9 (AUC: 0.622) Data are representative of at least three independent experiments each. AUC, area under the curve.
Similar articles
- Human Plasma Extracellular Vesicle Isolation and Proteomic Characterization for the Optimization of Liquid Biopsy in Multiple Myeloma.
Reale A, Khong T, Xu R, Chen M, Mithraprabhu S, Bingham N, Spencer A, Greening DW. Reale A, et al. Methods Mol Biol. 2021;2261:151-191. doi: 10.1007/978-1-0716-1186-9_10. Methods Mol Biol. 2021. PMID: 33420989 - Protein Profiling and Sizing of Extracellular Vesicles from Colorectal Cancer Patients via Flow Cytometry.
Tian Y, Ma L, Gong M, Su G, Zhu S, Zhang W, Wang S, Li Z, Chen C, Li L, Wu L, Yan X. Tian Y, et al. ACS Nano. 2018 Jan 23;12(1):671-680. doi: 10.1021/acsnano.7b07782. Epub 2018 Jan 8. ACS Nano. 2018. PMID: 29300458 - Nanoparticle-Aided Detection of Colorectal Cancer-Associated Glycoconjugates of Extracellular Vesicles in Human Serum.
Vinod R, Mahran R, Routila E, Leivo J, Pettersson K, Gidwani K. Vinod R, et al. Int J Mol Sci. 2021 Sep 25;22(19):10329. doi: 10.3390/ijms221910329. Int J Mol Sci. 2021. PMID: 34638669 Free PMC article. - Extracellular vesicles for liquid biopsy in prostate cancer: where are we and where are we headed?
Minciacchi VR, Zijlstra A, Rubin MA, Di Vizio D. Minciacchi VR, et al. Prostate Cancer Prostatic Dis. 2017 Sep;20(3):251-258. doi: 10.1038/pcan.2017.7. Epub 2017 Apr 4. Prostate Cancer Prostatic Dis. 2017. PMID: 28374743 Free PMC article. Review. - The emerging clinical potential of circulating extracellular vesicles for non-invasive glioma diagnosis and disease monitoring.
Hallal S, Ebrahimkhani S, Shivalingam B, Graeber MB, Kaufman KL, Buckland ME. Hallal S, et al. Brain Tumor Pathol. 2019 Apr;36(2):29-39. doi: 10.1007/s10014-019-00335-0. Epub 2019 Mar 11. Brain Tumor Pathol. 2019. PMID: 30859343 Review.
Cited by
- Exosomes: novel implications in diagnosis and treatment of gastrointestinal cancer.
Rahbari M, Rahbari N, Reissfelder C, Weitz J, Kahlert C. Rahbari M, et al. Langenbecks Arch Surg. 2016 Dec;401(8):1097-1110. doi: 10.1007/s00423-016-1468-2. Epub 2016 Jun 24. Langenbecks Arch Surg. 2016. PMID: 27342853 Review. - Osteoclast-derived small extracellular vesicles induce osteogenic differentiation via inhibiting ARHGAP1.
Liang M, Yin X, Zhang S, Ai H, Luo F, Xu J, Dou C, Dong S, Ma Q. Liang M, et al. Mol Ther Nucleic Acids. 2021 Feb 4;23:1191-1203. doi: 10.1016/j.omtn.2021.01.031. eCollection 2021 Mar 5. Mol Ther Nucleic Acids. 2021. PMID: 33664997 Free PMC article. - Non-destructive and efficient method for obtaining miRNA information in cells by artificial extracellular vesicles.
Maeda F, Adachi S, Natsume T. Maeda F, et al. Sci Rep. 2023 Dec 14;13(1):22231. doi: 10.1038/s41598-023-48995-5. Sci Rep. 2023. PMID: 38097629 Free PMC article. - Proteomic Analysis of Exosomes for Discovery of Protein Biomarkers for Prostate and Bladder Cancer.
Wang YT, Shi T, Srivastava S, Kagan J, Liu T, Rodland KD. Wang YT, et al. Cancers (Basel). 2020 Aug 19;12(9):2335. doi: 10.3390/cancers12092335. Cancers (Basel). 2020. PMID: 32825017 Free PMC article. Review. - Dual Imaging Single Vesicle Surface Protein Profiling and Early Cancer Detection.
Amrhein K, Taylor ML, Wilson R, Gallops CE, Annamer A, Vinduska V, Kwizera EA, Zhang H, Wang Y, Hoang TB, Huang X. Amrhein K, et al. ACS Appl Mater Interfaces. 2023 Jan 18;15(2):2679-2692. doi: 10.1021/acsami.2c19235. Epub 2023 Jan 4. ACS Appl Mater Interfaces. 2023. PMID: 36598405 Free PMC article.
References
- Iero M. et al.. Tumour-released exosomes and their implications in cancer immunity. Cell Death Differ. 15, 80–88 (2008). - PubMed
- Webber J., Steadman R., Mason M. D., Tabi Z. & Clayton A. Cancer exosomes trigger fibroblast to myofibroblast differentiation. Cancer Res. 70, 9621–9630 (2010). - PubMed
- Al-Nedawi K. et al.. Intercellular transfer of the oncogenic receptor EGFRvIII by microvesicles derived from tumour cells. Nat. Cell Biol. 10, 619–624 (2008). - PubMed
- Taylor D. D. & Gercel-Taylor C. MicroRNA signatures of tumor-derived exosomes as diagnostic biomarkers of ovarian cancer. Gynecol. Oncol. 110, 13–21 (2008). - PubMed
Publication types
MeSH terms
Substances
LinkOut - more resources
Full Text Sources
Other Literature Sources
Medical
Miscellaneous


