Biophysical properties of intrinsically disordered p130Cas substrate domain--implication in mechanosensing - PubMed (original) (raw)
. 2014 Apr 10;10(4):e1003532.
doi: 10.1371/journal.pcbi.1003532. eCollection 2014 Apr.
Soumya Ranganathan 2, Ruchuan Liu 3, Fei Wu 4, Hiroaki Machiyama 2, Rong Gao 2, Hiroaki Hirata 5, Neelesh Soni 6, Takashi Ohe 7, Christopher W V Hogue 2, M S Madhusudhan 8, Yasuhiro Sawada 9
Affiliations
- PMID: 24722239
- PMCID: PMC3983058
- DOI: 10.1371/journal.pcbi.1003532
Biophysical properties of intrinsically disordered p130Cas substrate domain--implication in mechanosensing
Kinya Hotta et al. PLoS Comput Biol. 2014.
Abstract
Mechanical stretch-induced tyrosine phosphorylation in the proline-rich 306-residue substrate domain (CasSD) of p130Cas (or BCAR1) has eluded an experimentally validated structural understanding. Cellular p130Cas tyrosine phosphorylation is shown to function in areas without internal actomyosin contractility, sensing force at the leading edge of cell migration. Circular dichroism shows CasSD is intrinsically disordered with dominant polyproline type II conformations. Strongly conserved in placental mammals, the proline-rich sequence exhibits a pseudo-repeat unit with variation hotspots 2-9 residues before substrate tyrosine residues. Atomic-force microscopy pulling experiments show CasSD requires minimal extension force and exhibits infrequent, random regions of weak stability. Proteolysis, light scattering and ultracentrifugation results show that a monomeric intrinsically disordered form persists for CasSD in solution with an expanded hydrodynamic radius. All-atom 3D conformer sampling with the TraDES package yields ensembles in agreement with experiment when coil-biased sampling is used, matching the experimental radius of gyration. Increasing β-sampling propensities increases the number of prolate conformers. Combining the results, we conclude that CasSD has no stable compact structure and is unlikely to efficiently autoinhibit phosphorylation. Taking into consideration the structural propensity of CasSD and the fact that it is known to bind to LIM domains, we propose a model of how CasSD and LIM domain family of transcription factor proteins may function together to regulate phosphorylation of CasSD and effect machanosensing.
Conflict of interest statement
The authors have declared that no competing interests exist.
Figures
Figure 1. Phosphorylation of p130Cas does not depend on actomyosin contractility.
(A) Scheme showing a cell experiencing a tensile force from the extracellular matrix (ECM). (B) Close-up view of the molecular interactions occurring at the cell–ECM junction. Proteins associated with the adhesions (multi-colored circles) and a mechanosensing protein (yellow) are shown as stretched by the inward-facing cytoskeletal contraction forces (F Cytoskeletal) and the external tensile forces (F External). (C) p130Cas-deficient fibroblasts expressing GFP–p130Cas in the presence (the “Blebbistatin” row) or absence (the “DMSO” row) of 10 µM blebbistatin were viewed with a TIRF microscope. Differential interference contrast (DIC, first column), GFP TIRF (Cas, second column), and Alexa546 TIRF (p-Cas, third column) images of a leading cell in scratched monolayer were acquired. Merged images of GFP and Alexa546 (Merge, fourth column) are shown. Scale bar: 10 µm. (D) HEK293 cells cultured on collagen-coated substrate were treated with DMSO (0.1%), blebbistatin (50 µM), cytochalasin D (0.5 µM) or latrunculin B (0.5 µM) for 30 minutes. After treatment, the cells were lysed and equivalent amounts of cell lysates were subjected to SDS-PAGE followed by western blot analysis using anti-phospho-p130Cas-Y165 (pCas-165) and anti-p130Cas (αCas3) antibody.
Figure 2. AFM stretching of individual CasSD–I27–CasSD–I27 molecules in a constant-velocity mode.
(A) Scheme of the CasSD–I27–CasSD–I27 protein construct used in the current study where it is stretched from the two termini. (B) Typical force vs. extension trajectories obtained. Only the curves showing signatures of two I27 unfolding peaks (ΔL = 28±2 nm, F>100 pN, labeled +) are recorded (73 traces), and any other feature (labeled *) not associated with I27 is assigned to CasSD domains. Curve i (type-1), a typical trajectory with only two force peaks for I27, indicating that this CasSD has a floppy structure with almost no resistance to AFM pulling (below the detection limit 15 pN); Curve ii to iv (type-2), typical trajectories with some features for CasSD. Type-1 curves (42 traces) dominate. (C) A plot of unfolding peak forces vs. contour length changes ΔL from type-2 curves as shown in (A) (I27 excluded), showing points distributed without correlation between peak forces and ΔL for all unfolding events. Top and right side panels of (C) show broadly and randomly distributed histograms of peak force and ΔL respectively.
Figure 3. Characterization of CasSD by analytical size-exclusion chromatography.
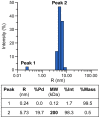
Purified CasSD was subjected to an analytical size-exclusion chromatography. Sample buffer and running buffer used were 10 mM potassium phosphate at pH 7.5, 100 mM potassium chloride, 1 mM EDTA and 5% (v/v) glycerol. Reference proteins were also subjected to the same chromatographic treatment for comparison. Red: ferritin; orange: catalase tetramer; green: bovine serum albumin; blue: ribonuclease A. Ferritin assumes a 440-kDa complex comprised of 24 subunits of light and heavy chains. Peaks eluting at a higher elution volume are thought to be ferritin molecules comprised of fewer subunits.
Figure 4. Dynamic light scattering measurements of purified CasSD.
Diffusion coefficient, hydrodynamic radius, molecular weight and polydispersity of CasSD were calculated from the measurements. CasSD was in 10% (v/v) glycerol. Measurements collected at CasSD concentrations raging from 1 to 3 mg/mL were similar to each other.
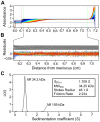
Figure 5. Sedimentation velocity analytical ultracentrifugation of purified CasSD.
CasSD was subjected to analytical ultracentrifugation experiment in 10% (v/v) glycerol at a concentration of 1 mg/mL at 4°C over 7.3 hours. Data was fit to the continuous distribution model to obtain the experimental molecular weight, Stokes radius and frictional ratio of CasSD. (A) Raw data from the time-course measurement of absorbance of the sample at 280 nm along the sample cell length. (B) Residuals after fitting the data to the continuous size-distribution model. (C) Sedimentation coefficient distributions c(s) calculated from the sedimentation profile showing the calculated parameters in the inset.
Figure 6. Circular dichroism (CD) spectra of CasSD.
(A) CD spectrum of CasSD at 0.2 mg/mL concentration in 10 mM sodium phosphate pH 7.8 (black line). Standard spectra for reference samples with known secondary structures are also given for comparison. Thin orange: α-helix; Thin green: β-sheet; Red: polyproline II; Blue: random coil. (B) Increase of molar ellipticity in the 220–240 nm region of the CasSD CD spectrum with increasing concentration of urea.
Figure 7. Consensus of predictions of CasSD disorderliness using multiple prediction programs.
YxxP motif is represented by a green bar with a circled P representing the tyrosine residue to be phosphorylated. Residues predicted to be disordered by less than half of the programs are in black, and those predicted by progressively more programs are colored in purple, orange, and red. Lastly, a segment predicted by NetTurn P1.0 to assume a β-turn is shown by a pink Ω-shaped bar. See the Materials and Methods for details.
Figure 8. Histograms from TraDES sampling.
(A) Coil-sampled ensemble. (B) β-sampled ensemble. (C) 3-state sampled ensemble. Solid blue line is the peak value. Solid red line is the mean value. Dashed red line is the median. Dotted red lines are at standard deviation, however the curves are not Gaussian, so the dotted blue lines bound the full-width at half max (FWHM).
Figure 9. Relative abundance of sampled conformations.
The relative frequency of PPII (blue line), α (red line) and β (green line) conformations in the (A) coil-sampled, (B) β-sampled and (C) 3-state ensembles. The frequencies are plotted against the radius of gyration that is binned into 5 Å windows.
Figure 10. LIM pair binding peptides and spacer regions.
Simple hypothetical model of a LIM domain pair (shown in green and purple ribbon diagram) bound to CasSD shown in yellow with its secondary structural elements colored in red. Wavy red lines and red arrows represent PPII helices and β-strands, respectively. Hydrogen bonds between LIM domains and CasSD are depicted in blue dotted lines. Mechanical stretching force is represented by gray arrows.
Similar articles
- P130Cas substrate domain is intrinsically disordered as characterized by single-molecule force measurements.
Lu C, Wu F, Qiu W, Liu R. Lu C, et al. Biophys Chem. 2013 Oct-Nov;180-181:37-43. doi: 10.1016/j.bpc.2013.06.008. Epub 2013 Jun 18. Biophys Chem. 2013. PMID: 23827411 - Force sensing by mechanical extension of the Src family kinase substrate p130Cas.
Sawada Y, Tamada M, Dubin-Thaler BJ, Cherniavskaya O, Sakai R, Tanaka S, Sheetz MP. Sawada Y, et al. Cell. 2006 Dec 1;127(5):1015-26. doi: 10.1016/j.cell.2006.09.044. Cell. 2006. PMID: 17129785 Free PMC article. - The focal adhesion targeting domain of p130Cas confers a mechanosensing function.
Bradbury PM, Turner K, Mitchell C, Griffin KR, Middlemiss S, Lau L, Dagg R, Taran E, Cooper-White J, Fabry B, O'Neill GM. Bradbury PM, et al. J Cell Sci. 2017 Apr 1;130(7):1263-1273. doi: 10.1242/jcs.192930. Epub 2017 Feb 21. J Cell Sci. 2017. PMID: 28223315 - Biophysical Methods to Investigate Intrinsically Disordered Proteins: Avoiding an "Elephant and Blind Men" Situation.
Uversky VN. Uversky VN. Adv Exp Med Biol. 2015;870:215-60. doi: 10.1007/978-3-319-20164-1_7. Adv Exp Med Biol. 2015. PMID: 26387104 Review. - Molecular Dynamics Simulations Combined with Nuclear Magnetic Resonance and/or Small-Angle X-ray Scattering Data for Characterizing Intrinsically Disordered Protein Conformational Ensembles.
Chan-Yao-Chong M, Durand D, Ha-Duong T. Chan-Yao-Chong M, et al. J Chem Inf Model. 2019 May 28;59(5):1743-1758. doi: 10.1021/acs.jcim.8b00928. Epub 2019 Mar 18. J Chem Inf Model. 2019. PMID: 30840442 Review.
Cited by
- Early events in cell spreading as a model for quantitative analysis of biomechanical events.
Wolfenson H, Iskratsch T, Sheetz MP. Wolfenson H, et al. Biophys J. 2014 Dec 2;107(11):2508-14. doi: 10.1016/j.bpj.2014.10.041. Epub 2014 Dec 2. Biophys J. 2014. PMID: 25468330 Free PMC article. Review. - Residue-by-Residue View of In Vitro FUS Granules that Bind the C-Terminal Domain of RNA Polymerase II.
Burke KA, Janke AM, Rhine CL, Fawzi NL. Burke KA, et al. Mol Cell. 2015 Oct 15;60(2):231-41. doi: 10.1016/j.molcel.2015.09.006. Epub 2015 Oct 8. Mol Cell. 2015. PMID: 26455390 Free PMC article. - Cas phosphorylation regulates focal adhesion assembly.
Kumar S, Stainer A, Dubrulle J, Simpkins C, Cooper JA. Kumar S, et al. Elife. 2023 Jul 25;12:e90234. doi: 10.7554/eLife.90234. Elife. 2023. PMID: 37489578 Free PMC article. - Structural Characterization of Phosducin and Its Complex with the 14-3-3 Protein.
Kacirova M, Kosek D, Kadek A, Man P, Vecer J, Herman P, Obsilova V, Obsil T. Kacirova M, et al. J Biol Chem. 2015 Jun 26;290(26):16246-60. doi: 10.1074/jbc.M115.636563. Epub 2015 May 13. J Biol Chem. 2015. PMID: 25971962 Free PMC article. - The Proline/Glycine-Rich Region of the Biofilm Adhesion Protein Aap Forms an Extended Stalk that Resists Compaction.
Yarawsky AE, English LR, Whitten ST, Herr AB. Yarawsky AE, et al. J Mol Biol. 2017 Jan 20;429(2):261-279. doi: 10.1016/j.jmb.2016.11.017. Epub 2016 Nov 25. J Mol Biol. 2017. PMID: 27890783 Free PMC article.
References
- Gustavsson A, Yuan M, Fällman M (2004) Temporal dissection of β1-integrin signaling indicates a role for p130Cas-Crk in filopodia formation. J Biol Chem 279: 22893–22901. - PubMed
- Giancotti FG, Tarone G (2003) Positional control of cell fate through joint integrin/receptor protein kinase signaling. Annu Rev Cell Dev Biol 19: 173–206. - PubMed
- Wei L, Yang Y, Zhang X, Yu Q (2002) Anchorage-independent phosphorylation of p130(Cas) protects lung adenocarcinoma cells from anoikis. J Cell Biochem 87: 439–449. - PubMed
- Auvinen M, Paasinen A, Andersson LC, Hölttä E (1992) Ornithine decarboxylase activity is critical for cell transformation. Nature 360: 355–358. - PubMed
- Mayer BJ, Hirai H, Sakai R (1995) Evidence that SH2 domains promote processive phosphorylation by protein-tyrosine kinases. Curr Biol 5: 296–305. - PubMed
Publication types
MeSH terms
Substances
LinkOut - more resources
Full Text Sources
Other Literature Sources


