Activity-dependent p25 generation regulates synaptic plasticity and Aβ-induced cognitive impairment - PubMed (original) (raw)
. 2014 Apr 10;157(2):486-498.
doi: 10.1016/j.cell.2014.01.065.
Paola Giusti-Rodríguez 1, Ying Zhou 1, Andrii Rudenko 1, Sukhee Cho 1, Kristie T Ota 1, Christine Park 1, Holger Patzke 1, Ram Madabhushi 1, Ling Pan 1, Alison E Mungenast 1, Ji-Song Guan 1, Ivana Delalle 2, Li-Huei Tsai 3
Affiliations
- PMID: 24725413
- PMCID: PMC4327772
- DOI: 10.1016/j.cell.2014.01.065
Activity-dependent p25 generation regulates synaptic plasticity and Aβ-induced cognitive impairment
Jinsoo Seo et al. Cell. 2014.
Abstract
Cyclin-dependent kinase 5 regulates numerous neuronal functions with its activator, p35. Under neurotoxic conditions, p35 undergoes proteolytic cleavage to liberate p25, which has been implicated in various neurodegenerative diseases. Here, we show that p25 is generated following neuronal activity under physiological conditions in a GluN2B- and CaMKIIα-dependent manner. Moreover, we developed a knockin mouse model in which endogenous p35 is replaced with a calpain-resistant mutant p35 (Δp35KI) to prevent p25 generation. The Δp35KI mice exhibit impaired long-term depression and defective memory extinction, likely mediated through persistent GluA1 phosphorylation at Ser845. Finally, crossing the Δp35KI mice with the 5XFAD mouse model of Alzheimer's disease (AD) resulted in an amelioration of β-amyloid (Aβ)-induced synaptic depression and cognitive impairment. Together, these results reveal a physiological role of p25 production in synaptic plasticity and memory and provide new insights into the function of p25 in Aβ-associated neurotoxicity and AD-like pathology.
Copyright © 2014 Elsevier Inc. All rights reserved.
Figures
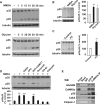
Figure 1. Activity-Induced p25 Generation in Hippocampus via NMDAR and CaMKIIα
(A) Primary cultured neurons were treated with NMDA (100 μM for 5 min) or glycine (200 μM for 3 min), and further incubated in conditioned media for the specified times. (B) Acute hippocampal slices were treated with NMDA (50 μM for 5 min) or glycine (100 μM for 3 min), followed by ACSF for 15 min. Right: the bar graph represents relative immunoreactivity of p25/ p35 compared with control (n = 3 per group). (C) WT mice were sacrificed after contextual FC (0.8 mA shock for 2 s) and hippocampi were isolated for immunoblotting (n = 6 per group). (D) Pretreatment of hippocampal slices with the AMPAR antagonist CNQX (10 μM), the NMDAR antagonist APV (50 μM), the GluN2A subunit-specific inhibitor NVP-AAM077 (0.5 μM), the GluN2B subunit-specific inhibitor ifenprodil (10 μM), the CaMKIIα inhibitor KN-62 (10 μM), or the calpain inhibitor calpeptin (10 μM) followed by NMDA treatment (n = 3–4 per group). (E) PSD fractions from WT hippocampus were subjected to the IP with an anti-p35 or anti-CaMKIIα antibody. The asterisk represents a nonspecific background band. *p < 0.05, **p < 0.01, ***p < 0.001 by Student's t test; error bars ± SEM. See also Figure S1.
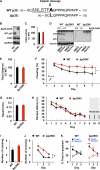
Figure 2. Normal Learning but Impaired Memory Extinction in Δp35KI Mice
(A) Strategy for generating the calpain-mediated, cleavage-resistant p35 protein. (B) Expression levels of p35 and Δp35 in the fore-brain of WT and Δp35KI mice, respectively. The asterisk represents a nonspecific background band. (C) IP-linked Cdk5 kinase assay was performed on WT or Δp35KI brain lysates and normalized to WT (n = 4 per group). (D) p25 expression in WT and Δp35KI hippocampal slices following NMDA or glycine treatment. Δp35 expression in Δp35KI hippocampus was confirmed by immunoblotting with an anti-HA antibody. The asterisk represents a nonspecific background band. (E) Basal movement behavior of WT (n = 9) and Δp35KI (n = 8) mice during the habituation period before FC. (F) Fear memory extinction testing by daily re-exposure to the conditioning chamber (repeated-measures ANOVA). (G) Swim speeds of WT (n = 10) and Δp35KI (n = 10) mice during the water maze test. (H) Escape latencies of WT and Δp35KI mice in the Morris water maze test. (I) Number of platform crossings by WT and Δp35KI mice on the first probe test day. (J) Number of platform crossings by WT and Δp35KI mice during repeated probe trials (repeated-measures ANOVA). (K) Time spent by WT and Δp35KI mice in the target or the opposite quadrant during repeated probe trials (Student's t test). *p < 0.05; **p < 0.01; ***p < 0.001; error bars ± SEM. See also Figures S2 and S3.
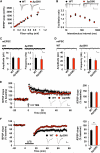
Figure 3. Normal Synaptic Transmission and LTP, but Impaired LTD, in Δp35KI Hippocampus
(A) The synaptic input-output relationship was obtained by plotting the slopes of evoked fEPSPs against fiber-volley amplitude. WT, n = 7 slices from 4 mice; Δp35KI, n = 8 slices from 4 mice. Scale bars, 0.5 mV and 20 ms. (B) The ratios of paired-pulse facilitation (second fEPSP slope/first fEPSP slope) were plotted as a function of interstimulus interval (ms). WT, n = 6 slices from 3 mice; Δp35KI, n = 5 slices from 3 mice. Scale bars, 0.5 mV and 200 ms. (C) mEPSC amplitude and frequency in CA1 pyramidal neurons of WT and Δp35KI mice (WT, amplitude: 10.5% ± 1.1%, frequency: 1.0% ± 0.3%, 12 slices from 3 mice; Δp35KI, amplitude: 10.2% ± 0.5%, frequency: 0.90% ± 0.3%, 11 slices from 3 mice). Scale bars, 10 pA and 200 ms. (D) mIPSC amplitude and frequency in CA1 pyramidal neurons of WT and Δp35KI mice (WT, amplitude: 29.0% ± 1.8%, frequency: 2.5% ± 0.3%, 13 slices from 3 mice; Δp35KI, amplitude: 25.9% ± 1.3%, frequency: 2.2% ± 0.4%, 11 slices from 3 mice). Scale bars, 10 pA and 200 ms. (E) LTP was induced by 33 TBS at the Schaffer collateral-CA1 synapses of WT or Δp35KI mice. Sample traces represent fEPSPs at 1 min before (gray) and 1 hr after (black) TBS. Scale bars, 0.5 mV and 10 ms. Right: the magnitude of LTP was calculated by comparing the average slopes of fEPSPs during the last 10 min of recordings with those recorded before stimulation (WT: 137.3% ± 11.2%, 9 slices from 4 mice; Δp35KI: 136.1% ± 10.0%, 6 slices from 3 mice). (F) LTD was induced by SP-LFS at the Schaffer collateral-CA1 synapses of WT or Δp35KI mice. Sample traces represent fEPSPs at 1 min before (gray) and 1 hr after (black) SP-LFS. Scale bars, 0.5 mV and 10 ms. Right: the magnitude of LTD was calculated by comparing the average slopes of fEPSPs during the last 10 min of recordings with those recorded before stimulation (WT: 75.0% ± 5.3%, 7 slices from 4 mice; Δp35KI: 96.1% ± 2.3%, 8 slices from 4 mice). **p < 0.01 by Student's t test; error bars ± SEM. See also Figure S4.
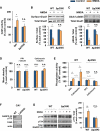
Figure 4. p25/Cdk5 Mediates NMDA-Induced AMPAR Endocytosis by Inhibiting DARPP-32 and Activating PP1 and Calcineurin at Hippocampal Synapses
(A) NMDA was applied to acute hippocampal slices for 5 min, followed by ACSF for an additional 5 min. Cdk5 kinase assay was performed on WT or Δp35KI hippocampal lysates, and Cdk5 activity was normalized to each untreated control (n = 4 per group). (B) NMDA was applied to acute hippocampal slices and the slices were then allowed to recover for 30 min. Biotinylation assay was performed to measure surface/total levels of GluA1. Bottom: the relative immunoreactivity of surface GluA1/total GluA1 levels were normalized to each untreated control (n = 3 per group). (C) NMDA was applied to acute hippocampal slices and the slices were allowed to recover for 15 min before being lysed for immunoblotting. Bottom: the relative immunoreactivity of GluA1 pSer845/total GluA1 was normalized to each untreated control (n = 6 per group). (D) The expression levels of PP1 and calcineurin before and after NMDA treatment were examined by immunoblotting, and relative immunoreactivity of PP1 or calcineurin was normalized to each untreated control (n = 3 per group). (E) NMDA was applied to acute hippocampal slices and the slices were allowed to recover for 5 min. Protein phosphatase assays were performed on WT or Δp35KI hippocampal lysates, and PP1 and calcineurin activity was normalized to WT control (n = 3 per group). (F) Immunoblot analysis was performed with an anti-DARPP-32 pThr75 antibody using the lysates from hippocampal CA1 of Cdk5f/f/T29 mice. An anti-Cdk5 antibody was used for confirmation of Cdk5 knockout. (G) NMDA was applied to acute hippocampal slices and the slices were allowed to recover for 5 min before being lysed for immunoblotting. Right: the relative immunoreactivity of DARPP-32 pThr75/total DARPP-32 was normalized to each control (n = 4 per group). *p < 0.05, **p < 0.01 by Student's t test; error bars ± SEM. See also Figure S4.
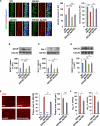
Figure 5. Prevention of Aβ-Induced Synaptic Depression and Excessive DARPP-32 Inhibition and AMPAR Dephosphorylation in 5XFAD Mouse Brain by Blockade of p25 Generation
(A) Stable basal synaptic transmission was recorded from WT or Δp35KI hippocampal slices for at least 15 min, followed by incubation in Aβ1-42 (0.2 μM) for 40 min. Scale bars, 0.5 mV and 10 ms. Sample traces represent fEPSPs at 1 min before (gray) and 40 min after (black) Aβ1-42 treatment. Right: the magnitude of Aβ1-42-induced depression was calculated by comparing the average slopes of fEPSPs during the last 10 min of recordings with those obtained before Aβ1-42 treatment (WT: 8.8%± 3.3%, 7 slices from 3 mice; Δp35KI: 1.2% ± 2.4%, 6 slices from 3 mice). Student's t test. (B) Levels of p25 in WT and Δp35KI hippocampus after incubation with Aβ1-42. Δp35 expression in Δp35KI hippocampus was confirmed by immunoblotting with an anti-HA antibody. The asterisk represents a nonspecific background band. Right: the bar graph represents relative immunoreactivity of p25/p35 compared with the WT untreated group (n = 5 per group; Student's t test). (C) IP-linked Cdk5 kinase assays were performed on WT, 5XFAD, Δp35KI, or 5XFAD;Δp35KI hippocampal lysates (n = 5 per group). (D) The relative immunoreactivity of DARPP-32 pThr75/total DARPP-32 was normalized to WT (n = 4–6 per group; p < 0.01 by ANOVA). (E) The relative immunoreactivity of GluA1 pSer845/total GluA1 was normalized to WT (n = 3 per group; p < 0.01 by ANOVA). *p < 0.05, **p < 0.01, ***p < 0.001 by Student's t test or Tukey's post hoc analysis; error bars ± SEM. See also Figure S5.
Figure 6. Inhibition of p25 Generation Rescues Synaptic Dysfunction and Cognitive Impairment in 5XFAD Mice
(A) LTP was induced by 4× TBS at Schaffer collateral-CA1 synapses. Sample traces represent fEPSPs at 1 min before (gray) and 1 hr after (black) TBS. Scale bars, 0.5 mV and 10 ms. Right: the magnitude of LTP was calculated by comparing the average slopes of fEPSPs during the last 10 min of recordings with those recorded before stimulation. WT: 146.0% ± 5.1%, 8 slices from 5 mice; 5XFAD: 125.2% ± 8.1%, 7 slices from 5 mice; Δp35KI: 157.0% ± 10.1%, 5 slices from 3 mice; 5XFAD;Δp35KI: 156.8% ± 5.9%, 5 slices from 3 mice, p < 0.01 by ANOVA. (B) Novel-object test with WT, Δp35KI, 5XFAD, and 5XFAD;Δp35KI mice. Right: discrimination index for novel-object recognition (WT: 61.8 ± 2.8, n = 8; 5XFAD: 45.9 ± 3.5, n = 7; Δp35KI: 61.9 ± 2.8, n = 6; 5XFAD;Δp35KI: 66.6 ± 1.3, n = 9, p < 0.001 by ANOVA). (C) Contextual and cued FC tests with WT, Δp35KI, 5XFAD, and 5XFAD;Δp35KI mice. Left: contextual FC (WT: 65.6% ± 6.4%, n = 10; 5XFAD: 33.3% ± 7.6%, n = 12; Δp35KI: 50.0% ± 4.7%, n = 11; 5XFAD;Δp35KI: 72.2% ± 7.0%, n = 7, p < 0.05 by ANOVA). Right: cued FC (WT: 75.0% ± 5.0%, n = 10; 5XFAD: 44.9% ± 8.3%, n = 12; Δp35KI: 71.2% ± 3.9%, n = 11; 5XFAD;Δp35KI: 90.5% ± 3.1%, n = 7, p < 0.01 by ANOVA). §p = 0.08, *p < 0.05, **p < 0.01, ***p < 0.001 by Tukey's post hoc analysis; error bars ± SEM. See also Figure S6.
Figure 7. Inhibition of p25 Generation Attenuates Elevated HDAC2 Levels, Glial Activation, and Aβ Accumulation in 5XFAD Mice
(A) Immunohistochemistry with anti-HDAC2 and anti-acetylated H3K9/14 (AcH3) antibodies in hippocampal CA1 of WT, Δp35KI, 5XFAD, and 5XFAD;Δp35KI mice. Scale bar, 20 μm. Right: bar graphs represent the relative immunoreactivity of HDAC2 and AcH3 normalized to WT (n = 10–14 slices from 3 mice per group; p < 0.001 by ANOVA). (B) Relative immunoreactivity of GFAP in hippocampus of WT, Δp35KI, 5XFAD, and 5XFAD;Δp35KI mice normalized to WT (n = 4 per group; p < 0.001 by ANOVA). (C) Relative immunoreactivity of Iba-1 in the hippocampus of WT, Δp35KI, 5XFAD, and 5XFAD;Δp35KI mice normalized to WT (n = 4 per group; p < 0.05 by ANOVA). (D) Relative immunoreactivity of BACE1 in the hippocampus of WT, Δp35KI, 5XFAD, and 5XFAD;Δp35KI mice normalized to WT (n = 5 per group; p < 0.05 by ANOVA). (E) Immunohistochemistry with an anti-4G8 antibody in hippocampal CA1 of WT, Δp35KI, 5XFAD, and 5XFAD;Δp35KI mice. Scale bar, 100 mm. Middle: the number of Aβ plaques/mm2 in hippocampus was quantified and normalized to 5XFAD mice. Right: the size of Aβ plaques was measured and normalized to 5XFAD mice (n = 21–24 slices from 7 mice per group; Student's t test). (F) Hippocampal Aβ1-42 and Aβ1-40 levels were measured by ELISA and normalized to 5XFAD (n = 6–7 per group for Aβ1-42, and n = 3 per group for Aβ1-40 measurement; Student's t test). *p < 0.05, **p < 0.01, ***p < 0.001 by Student's t test or Tukey's post hoc analysis; error bars ± SEM. See also Figure S7.
Similar articles
- Synaptic deficits are rescued in the p25/Cdk5 model of neurodegeneration by the reduction of β-secretase (BACE1).
Giusti-Rodríguez P, Gao J, Gräff J, Rei D, Soda T, Tsai LH. Giusti-Rodríguez P, et al. J Neurosci. 2011 Nov 2;31(44):15751-6. doi: 10.1523/JNEUROSCI.3588-11.2011. J Neurosci. 2011. PMID: 22049418 Free PMC article. - Inhibition of p25/Cdk5 Attenuates Tauopathy in Mouse and iPSC Models of Frontotemporal Dementia.
Seo J, Kritskiy O, Watson LA, Barker SJ, Dey D, Raja WK, Lin YT, Ko T, Cho S, Penney J, Silva MC, Sheridan SD, Lucente D, Gusella JF, Dickerson BC, Haggarty SJ, Tsai LH. Seo J, et al. J Neurosci. 2017 Oct 11;37(41):9917-9924. doi: 10.1523/JNEUROSCI.0621-17.2017. Epub 2017 Sep 14. J Neurosci. 2017. PMID: 28912154 Free PMC article. - Hypoxia increases Aβ-induced tau phosphorylation by calpain and promotes behavioral consequences in AD transgenic mice.
Gao L, Tian S, Gao H, Xu Y. Gao L, et al. J Mol Neurosci. 2013 Sep;51(1):138-47. doi: 10.1007/s12031-013-9966-y. Epub 2013 Jan 24. J Mol Neurosci. 2013. PMID: 23345083 - The regulation of cyclin-dependent kinase 5 activity through the metabolism of p35 or p39 Cdk5 activator.
Hisanaga S, Saito T. Hisanaga S, et al. Neurosignals. 2003 Sep-Oct;12(4-5):221-9. doi: 10.1159/000074624. Neurosignals. 2003. PMID: 14673209 Review. - Is there a role of the cyclin-dependent kinase 5 activator p25 in Alzheimer's disease?
Giese KP, Ris L, Plattner F. Giese KP, et al. Neuroreport. 2005 Nov 7;16(16):1725-30. doi: 10.1097/01.wnr.0000185019.67434.d2. Neuroreport. 2005. PMID: 16237316 Review.
Cited by
- Transient enhancement of proliferation of neural progenitors and impairment of their long-term survival in p25 transgenic mice.
Zou D, Zhou Y, Liu L, Dong F, Shu T, Zhou Y, Tsai LH, Mao Y. Zou D, et al. Oncotarget. 2016 Jun 28;7(26):39148-39161. doi: 10.18632/oncotarget.9834. Oncotarget. 2016. PMID: 27283769 Free PMC article. - A novel human tau knock-in mouse model reveals interaction of Abeta and human tau under progressing cerebral amyloidosis in 5xFAD mice.
Barendrecht S, Schreurs A, Geissler S, Sabanov V, Ilse V, Rieckmann V, Eichentopf R, Künemund A, Hietel B, Wussow S, Hoffmann K, Körber-Ferl K, Pandey R, Carter GW, Demuth HU, Holzer M, Roßner S, Schilling S, Preuss C, Balschun D, Cynis H. Barendrecht S, et al. Alzheimers Res Ther. 2023 Jan 14;15(1):16. doi: 10.1186/s13195-022-01144-y. Alzheimers Res Ther. 2023. PMID: 36641439 Free PMC article. - S-nitrosylation-dependent proteasomal degradation restrains Cdk5 activity to regulate hippocampal synaptic strength.
Zhang P, Fu WY, Fu AK, Ip NY. Zhang P, et al. Nat Commun. 2015 Oct 27;6:8665. doi: 10.1038/ncomms9665. Nat Commun. 2015. PMID: 26503494 Free PMC article. - Calpain research for drug discovery: challenges and potential.
Ono Y, Saido TC, Sorimachi H. Ono Y, et al. Nat Rev Drug Discov. 2016 Dec;15(12):854-876. doi: 10.1038/nrd.2016.212. Epub 2016 Nov 11. Nat Rev Drug Discov. 2016. PMID: 27833121 Review. - Effects of BACE1 haploinsufficiency on APP processing and Aβ concentrations in male and female 5XFAD Alzheimer mice at different disease stages.
Devi L, Ohno M. Devi L, et al. Neuroscience. 2015 Oct 29;307:128-37. doi: 10.1016/j.neuroscience.2015.08.037. Epub 2015 Aug 24. Neuroscience. 2015. PMID: 26314636 Free PMC article.
References
- Angelo M, Plattner F, Irvine EE, Giese KP. Improved reversal learning and altered fear conditioning in transgenic mice with regionally restricted p25 expression. Eur. J. Neurosci. 2003;18:423–431. - PubMed
- Bibb JA, Snyder GL, Nishi A, Yan Z, Meijer L, Fienberg AA, Tsai LH, Kwon YT, Girault JA, Czernik AJ, et al. Phosphorylation of DARPP-32 by Cdk5 modulates dopamine signalling in neurons. Nature. 1999;402:669–671. - PubMed
- Buckner RL, Snyder AZ, Shannon BJ, LaRossa G, Sachs R, Fotenos AF, Sheline YI, Klunk WE, Mathis CA, Morris JC, Mintun MA. Molecular, structural, and functional characterization of Alzheimer's disease: evidence for a relationship between default activity, amyloid, and memory. J. Neurosci. 2005;25:7709–7717. - PMC - PubMed
- Chae T, Kwon YT, Bronson R, Dikkes P, Li E, Tsai LH. Mice lacking p35, a neuronal specific activator of Cdk5, display cortical lamination defects, seizures, and adult lethality. Neuron. 1997;18:29–42. - PubMed
Publication types
MeSH terms
Substances
Grants and funding
- F31 GM080055/GM/NIGMS NIH HHS/United States
- R01 NS051874/NS/NINDS NIH HHS/United States
- HHMI/Howard Hughes Medical Institute/United States
- F31GM80055-03/GM/NIGMS NIH HHS/United States
LinkOut - more resources
Full Text Sources
Other Literature Sources
Medical
Molecular Biology Databases
Research Materials
