Loss of Tet enzymes compromises proper differentiation of embryonic stem cells - PubMed (original) (raw)
Loss of Tet enzymes compromises proper differentiation of embryonic stem cells
Meelad M Dawlaty et al. Dev Cell. 2014.
Abstract
Tet enzymes (Tet1/2/3) convert 5-methylcytosine (5mC) to 5-hydroxymethylcytosine (5hmC) and are dynamically expressed during development. Whereas loss of individual Tet enzymes or combined deficiency of Tet1/2 allows for embryogenesis, the effect of complete loss of Tet activity and 5hmC marks in development is not established. We have generated Tet1/2/3 triple-knockout (TKO) mouse embryonic stem cells (ESCs) and examined their developmental potential. Combined deficiency of all three Tets depleted 5hmC and impaired ESC differentiation, as seen in poorly differentiated TKO embryoid bodies (EBs) and teratomas. Consistent with impaired differentiation, TKO ESCs contributed poorly to chimeric embryos, a defect rescued by Tet1 reexpression, and could not support embryonic development. Global gene-expression and methylome analyses of TKO EBs revealed promoter hypermethylation and deregulation of genes implicated in embryonic development and differentiation. These findings suggest a requirement for Tet- and 5hmC-mediated DNA demethylation in proper regulation of gene expression during ESC differentiation and development.
Copyright © 2014 Elsevier Inc. All rights reserved.
Figures
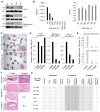
Figure 1. Loss of 5hmC and restricted differentiation potential of Tet TKO ES cells in embryoid body and teratoma formation assays
(A) Confirmation of loss of Tet enzymes in Tet TKO ESCs and differentiated cells by Western blot. (B) Quantification of 5hmC and 5mC in ESCs and EBs of the indicated genotypes by mass spectrometry. (C) Sections of paraffin-embedded EBs derived from ES cell lines of indicated genotypes stained with Hematoxylin and Eosin (H&E). (D &E) RT-qPCR for markers of embryonic germ layers in day 10 EBs (D) and day 15 EBs (E) of the indicated genotypes. Data are normalized to Gapdh. (F) Representative images of each embryonic germ layer from hematoxylin and eosin (H&E)-stained sections of teratomas derived from ESCs of the indicated genotypes. N.D.= none detected. (G) Summary table of the various germ layer tissues detected in teratomas of indicated genotypes. For all panels, error bars indicate standard deviation. (See also Figure S1)
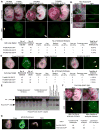
Figure 2. Limited contribution of Tet TKO ES cells to developing embryos in a chimera assay
A&B) Bright field and fluorescence images of E13.5 chimeric embryos generated by injecting Rosa26-EGFP targeted ESCs of the indicated genotypes into WT blastocysts. The very poor and weaker GFP signal in TKO ESC chimeras are highlighted in the images in B. C) Summary table for all cell lines tested in the chimera assay. D) Top: Bright field and fluorescence images of E9.5 chimeric embryos generated by injecting Rosa26-EGFP targeted ESCs of the indicated genotypes into WT blastocysts. Bottom: Summary table for all cell lines tested in this chimera assay. Asterisk indicates growth retarded and defective embryos. E) Southern blot confirming the negligible to no detection of the TKO-Rosa26-EGFP allele in DNA extracted from E13.5 TKO chimeric embryos. F) E14.5 chimeric embryos generated by injecting Rosa26-EGFP targeted ESCs of indicated genotypes into WT blastocysts. G) Left: Bright field and fluorescence images of E9.5 4N embryos generated by injecting Rosa26-EGFP targeted ESCs of the indicated genotypes into 4N WT blastocysts. Right: Summary table for all cell lines tested in the tetraploid complementation assay. For all panels, arrowheads point to poor GFP signal. (See also Figure S2)
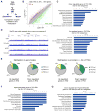
Figure 3. Aberrant promoter hypermethylation and deregulation of developmental genes in Tet TKO embryoid bodies
A) Schematic of the MeDIP and gene expression analyses to identify hypermethylated and down regulated genes during differentiation of TKO ES cells. B) Scatter plots showing differentially expressed genes in red (up regulated) or in green (down regulated) across a panel of TKO EBs when compared to WT EBs. C) Gene ontology analysis of differentially expressed genes in TKO EBs. D) MeDIP-seq profile of a 3 Mb region from mouse chromosome 6 with the Hoxa cluster in the center in two independent TKO and WT EB clones as an example for the general hypermethylation observed in TKO EBs. Enrichments are indicated as normalized read counts. E) Analysis of deregulated genes in TKO EBs correlating their expression to the methylation status of their promoters or gene bodies. The pie charts show the percentage of deregulated genes in TKO EBs that show hypermethylation compared to WT (green), hypomethylation compared to WT (yellow) or do not change (grey), in the gene body or the promoter (+/− 1000 bp from the TSS). F) Gene ontology analysis of all genes with hypermethylated promoter regions (normalized average read counts > 4 in the region +/− 1000 bp from the TSS) in TKO EBs. G) Gene ontology analysis of all genes down regulated in TKO EBs that also have differentially hypermethylated promoters (TKO vs. WT). (See also Table S1)
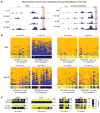
Figure 4. Gene specific bisulfite sequencing for validation of hypermethylation of deregulated developmental genes in Tet TKO embryoid bodies
A) MeDIP-seq profiles of representative developmental genes in TKO EBs. Enrichments are indicated as normalized read counts. Red boxes indicate the genomic region analyzed by gene specific 454 bisulfite sequencing in B and C. B) Validation of MeDIP-data by gene specific 454 bisulfite sequencing. Results for a 200–300 bp region (see red box in A) at the promoters of indicated genes are shown as heatmaps in which each row represents one sequence read and each column an individual CpG site within the analyzed region. Individual blue boxes indicate methylated and yellow boxes indicate unmethylated CpG dinucleotides. Panels below heatmaps show the average methylation of each interrogated CpG for the analyzed DNA fragment. For color bar see C. Sequencing coverage (reads) are indicated. C) Heat maps for four additional promoter regions of the genes analyzed. Panels show the average methylation of each interrogated CpG according to the color bar shown on the right. Numbers indicate the sequencing coverage. (See also Figure S3)
Similar articles
- Combined deficiency of Tet1 and Tet2 causes epigenetic abnormalities but is compatible with postnatal development.
Dawlaty MM, Breiling A, Le T, Raddatz G, Barrasa MI, Cheng AW, Gao Q, Powell BE, Li Z, Xu M, Faull KF, Lyko F, Jaenisch R. Dawlaty MM, et al. Dev Cell. 2013 Feb 11;24(3):310-23. doi: 10.1016/j.devcel.2012.12.015. Epub 2013 Jan 24. Dev Cell. 2013. PMID: 23352810 Free PMC article. - MicroRNA-29b/Tet1 regulatory axis epigenetically modulates mesendoderm differentiation in mouse embryonic stem cells.
Tu J, Ng SH, Luk AC, Liao J, Jiang X, Feng B, Lun Mak KK, Rennert OM, Chan WY, Lee TL. Tu J, et al. Nucleic Acids Res. 2015 Sep 18;43(16):7805-22. doi: 10.1093/nar/gkv653. Epub 2015 Jun 30. Nucleic Acids Res. 2015. PMID: 26130713 Free PMC article. - Deletion of Tet proteins results in quantitative disparities during ESC differentiation partially attributable to alterations in gene expression.
Reimer M Jr, Pulakanti K, Shi L, Abel A, Liang M, Malarkannan S, Rao S. Reimer M Jr, et al. BMC Dev Biol. 2019 Jul 8;19(1):16. doi: 10.1186/s12861-019-0196-6. BMC Dev Biol. 2019. PMID: 31286885 Free PMC article. - Tet family of 5-methylcytosine dioxygenases in mammalian development.
Zhao H, Chen T. Zhao H, et al. J Hum Genet. 2013 Jul;58(7):421-7. doi: 10.1038/jhg.2013.63. Epub 2013 May 30. J Hum Genet. 2013. PMID: 23719188 Free PMC article. Review. - Mechanisms of TET protein-mediated DNA demethylation and its role in the regulation of mouse development.
Jia ZW, Gao SX, Zhang YC, Zhang XH. Jia ZW, et al. Yi Chuan. 2015 Jan;37(1):34-40. doi: 10.16288/j.yczz.2015.01.005. Yi Chuan. 2015. PMID: 25608811 Review.
Cited by
- Tex10 Coordinates Epigenetic Control of Super-Enhancer Activity in Pluripotency and Reprogramming.
Ding J, Huang X, Shao N, Zhou H, Lee DF, Faiola F, Fidalgo M, Guallar D, Saunders A, Shliaha PV, Wang H, Waghray A, Papatsenko D, Sánchez-Priego C, Li D, Yuan Y, Lemischka IR, Shen L, Kelley K, Deng H, Shen X, Wang J. Ding J, et al. Cell Stem Cell. 2015 Jun 4;16(6):653-68. doi: 10.1016/j.stem.2015.04.001. Epub 2015 Apr 30. Cell Stem Cell. 2015. PMID: 25936917 Free PMC article. - The Interactome between Metabolism and Gene Mutations in Myeloid Malignancies.
Gurnari C, Pagliuca S, Visconte V. Gurnari C, et al. Int J Mol Sci. 2021 Mar 19;22(6):3135. doi: 10.3390/ijms22063135. Int J Mol Sci. 2021. PMID: 33808599 Free PMC article. Review. - Specific functions of TET1 and TET2 in regulating mesenchymal cell lineage determination.
Cakouros D, Hemming S, Gronthos K, Liu R, Zannettino A, Shi S, Gronthos S. Cakouros D, et al. Epigenetics Chromatin. 2019 Jan 3;12(1):3. doi: 10.1186/s13072-018-0247-4. Epigenetics Chromatin. 2019. PMID: 30606231 Free PMC article. - Dynamic Enhancer DNA Methylation as Basis for Transcriptional and Cellular Heterogeneity of ESCs.
Song Y, van den Berg PR, Markoulaki S, Soldner F, Dall'Agnese A, Henninger JE, Drotar J, Rosenau N, Cohen MA, Young RA, Semrau S, Stelzer Y, Jaenisch R. Song Y, et al. Mol Cell. 2019 Sep 5;75(5):905-920.e6. doi: 10.1016/j.molcel.2019.06.045. Epub 2019 Aug 15. Mol Cell. 2019. PMID: 31422875 Free PMC article. - Genetic ablation of the TET family in retinal progenitor cells impairs photoreceptor development and leads to blindness.
Dvoriantchikova G, Moulin C, Fleishaker M, Almeida V, Pelaez D, Lam BL, Ivanov D. Dvoriantchikova G, et al. Proc Natl Acad Sci U S A. 2025 Mar 11;122(10):e2420091122. doi: 10.1073/pnas.2420091122. Epub 2025 Mar 7. Proc Natl Acad Sci U S A. 2025. PMID: 40053367
References
Publication types
MeSH terms
Substances
Grants and funding
- 5-R01-HDO45022/PHS HHS/United States
- P30 CA014051/CA/NCI NIH HHS/United States
- 5-R37-CA084198/CA/NCI NIH HHS/United States
- R37 HD045022/HD/NICHD NIH HHS/United States
- R37 CA084198/CA/NCI NIH HHS/United States
- R01 HD045022/HD/NICHD NIH HHS/United States
- R01 CA084198/CA/NCI NIH HHS/United States
LinkOut - more resources
Full Text Sources
Other Literature Sources
Molecular Biology Databases


