Global, regional, and national consumption levels of dietary fats and oils in 1990 and 2010: a systematic analysis including 266 country-specific nutrition surveys - PubMed (original) (raw)
Global, regional, and national consumption levels of dietary fats and oils in 1990 and 2010: a systematic analysis including 266 country-specific nutrition surveys
Renata Micha et al. BMJ. 2014.
Erratum in
Abstract
Objectives: To quantify global consumption of key dietary fats and oils by country, age, and sex in 1990 and 2010.
Design: Data were identified, obtained, and assessed among adults in 16 age- and sex-specific groups from dietary surveys worldwide on saturated, omega 6, seafood omega 3, plant omega 3, and trans fats, and dietary cholesterol. We included 266 surveys in adults (83% nationally representative) comprising 1,630,069 unique individuals, representing 113 of 187 countries and 82% of the global population. A multilevel hierarchical Bayesian model accounted for differences in national and regional levels of missing data, measurement incomparability, study representativeness, and sampling and modelling uncertainty.
Setting and population: Global adult population, by age, sex, country, and time.
Results: In 2010, global saturated fat consumption was 9.4%E (95%UI=9.2 to 9.5); country-specific intakes varied dramatically from 2.3 to 27.5%E; in 75 of 187 countries representing 61.8% of the world's adult population, the mean intake was <10%E. Country-specific omega 6 consumption ranged from 1.2 to 12.5%E (global mean=5.9%E); corresponding range was 0.2 to 6.5%E (1.4%E) for trans fat; 97 to 440 mg/day (228 mg/day) for dietary cholesterol; 5 to 3,886 mg/day (163 mg/day) for seafood omega 3; and <100 to 5,542 mg/day (1,371 mg/day) for plant omega 3. Countries representing 52.4% of the global population had national mean intakes for omega 6 fat ≥ 5%E; corresponding proportions meeting optimal intakes were 0.6% for trans fat (≤ 0.5%E); 87.6% for dietary cholesterol (<300 mg/day); 18.9% for seafood omega 3 fat (≥ 250 mg/day); and 43.9% for plant omega 3 fat (≥ 1,100 mg/day). Trans fat intakes were generally higher at younger ages; and dietary cholesterol and seafood omega 3 fats generally higher at older ages. Intakes were similar by sex. Between 1990 and 2010, global saturated fat, dietary cholesterol, and trans fat intakes remained stable, while omega 6, seafood omega 3, and plant omega 3 fat intakes each increased.
Conclusions: These novel global data on dietary fats and oils identify dramatic diversity across nations and inform policies and priorities for improving global health.
Conflict of interest statement
Competing interests: All authors have completed the ICMJE uniform disclosure form at www.icmje.org/coi\_disclosure.pdf and declare: no support from any organisation for the submitted work; no financial relationships with any organisations that might have an interest in the submitted work in the previous three years DM reports ad hoc honoraria for scientific presentations from Bunge, Pollock Institute, and Quaker Oats; ad hoc consulting fees from Foodminds, Nutrition Impact, Amarin, Astra Zeneca, Winston & Strawn, and Life Sciences Research Organization; membership of Unilever North America Scientific Advisory Board; royalties for an online chapter on fish oil from UpToDate.
Figures
Fig 1 Flow diagram of systematic search for nationally representative surveys of food and nutrient intake
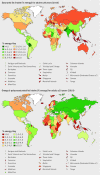
Fig 2 Global and regional mean consumption levels of dietary saturated fat and omega 6 polyunsaturated fat in 2010 for adults aged ≥20 years. See eTable 3 of data supplement for numerical mean estimates and uncertainty intervals
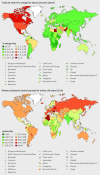
Fig 3 Global and regional mean consumption levels of dietary trans fat and cholesterol in 2010 for adults ≥20 years of age. See eTable 3 of data supplement for numerical mean estimates and uncertainty intervals
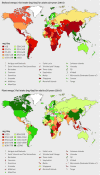
Fig 4 Global and regional mean consumption levels of dietary seafood omega 3 fat and plant omega 3 fat in 2010 for adults ≥20 years of age. See eTable 3 of data supplement for numerical mean estimates and uncertainty intervals
Fig 5 Global and regional mean consumption levels in 1990 and 2010 of dietary saturated fat, omega 6 polyunsaturated fat, trans fat, cholesterol, seafood omega 3 fat, and plant omega 3 fat for adults ≥20 years of age in relation to their uncertainty. See eTables 3 and 4 of data supplement for numerical mean estimates and uncertainty intervals
Comment in
- Nutritional survey data are inaccurate.
Winkler JT. Winkler JT. BMJ. 2014 May 14;348:g3204. doi: 10.1136/bmj.g3204. BMJ. 2014. PMID: 25134123 No abstract available. - Lack of evidence that saturated fat causes cardiovascular disease.
Ravnskov U. Ravnskov U. BMJ. 2014 May 14;348:g3205. doi: 10.1136/bmj.g3205. BMJ. 2014. PMID: 25134124 No abstract available. - Authors' reply to Winkler and Ravnskov.
Micha R, Mozaffarian D. Micha R, et al. BMJ. 2014 May 14;348:g3206. doi: 10.1136/bmj.g3206. BMJ. 2014. PMID: 25134125 No abstract available.
Similar articles
- Global, regional and national consumption of major food groups in 1990 and 2010: a systematic analysis including 266 country-specific nutrition surveys worldwide.
Micha R, Khatibzadeh S, Shi P, Andrews KG, Engell RE, Mozaffarian D; Global Burden of Diseases Nutrition and Chronic Diseases Expert Group (NutriCoDE). Micha R, et al. BMJ Open. 2015 Sep 24;5(9):e008705. doi: 10.1136/bmjopen-2015-008705. BMJ Open. 2015. PMID: 26408285 Free PMC article. - Impact of Nonoptimal Intakes of Saturated, Polyunsaturated, and Trans Fat on Global Burdens of Coronary Heart Disease.
Wang Q, Afshin A, Yakoob MY, Singh GM, Rehm CD, Khatibzadeh S, Micha R, Shi P, Mozaffarian D; Global Burden of Diseases Nutrition and Chronic Diseases Expert Group (NutriCoDE). Wang Q, et al. J Am Heart Assoc. 2016 Jan 20;5(1):e002891. doi: 10.1161/JAHA.115.002891. J Am Heart Assoc. 2016. PMID: 26790695 Free PMC article. - Fatty acid intakes and food sources in a population of older Australians.
Flood VM, Webb KL, Rochtchina E, Kelly B, Mitchell P. Flood VM, et al. Asia Pac J Clin Nutr. 2007;16(2):322-30. Asia Pac J Clin Nutr. 2007. PMID: 17468090 - Dietary fats and coronary heart disease.
Willett WC. Willett WC. J Intern Med. 2012 Jul;272(1):13-24. doi: 10.1111/j.1365-2796.2012.02553.x. J Intern Med. 2012. PMID: 22583051 Review. - Desirable intakes of polyunsaturated fatty acids in Indonesian adults.
Hanafiah A, Karyadi D, Lukito W, Muhilal, Supari F. Hanafiah A, et al. Asia Pac J Clin Nutr. 2007;16(4):632-40. Asia Pac J Clin Nutr. 2007. PMID: 18042522 Review.
Cited by
- The impact of dietary habits and metabolic risk factors on cardiovascular and diabetes mortality in countries of the Middle East and North Africa in 2010: a comparative risk assessment analysis.
Afshin A, Micha R, Khatibzadeh S, Fahimi S, Shi P, Powles J, Singh G, Yakoob MY, Abdollahi M, Al-Hooti S, Farzadfar F, Houshiar-Rad A, Hwalla N, Koksal E, Musaiger A, Pekcan G, Sibai AM, Zaghloul S, Danaei G, Ezzati M, Mozaffarian D; 2010 Global Burden of Diseases, Injuries, and Risk Factors Study: NUTRItrition and ChrOnic Diseases Expert Group (NUTRICODE), and Metabolic Risk Factors of ChrOnic Diseases Collaborating Group. Afshin A, et al. BMJ Open. 2015 May 20;5(5):e006385. doi: 10.1136/bmjopen-2014-006385. BMJ Open. 2015. PMID: 25995236 Free PMC article. - Dietary Fat Intake and Metabolic Syndrome in Older Adults.
Julibert A, Bibiloni MDM, Mateos D, Angullo E, Tur JA. Julibert A, et al. Nutrients. 2019 Aug 14;11(8):1901. doi: 10.3390/nu11081901. Nutrients. 2019. PMID: 31416272 Free PMC article. - Improvement of Intramuscular Fat in longissimus Muscle of Finishing Thai Crossbred Black Pigs by Perilla Cake Supplementation in a Low-Lysine Diet.
Sringarm K, Chaiwang N, Wattanakul W, Mahinchai P, Satsook A, Norkeaw R, Seel-Audom M, Moonmanee T, Mekchay S, Sommano SR, Ruksiriwanich W, Rachtanapun P, Jantanasakulwong K, Arjin C. Sringarm K, et al. Foods. 2022 Mar 22;11(7):907. doi: 10.3390/foods11070907. Foods. 2022. PMID: 35406994 Free PMC article. - Scientific advice related to nutrient profiling for the development of harmonised mandatory front-of-pack nutrition labelling and the setting of nutrient profiles for restricting nutrition and health claims on foods.
EFSA Panel on Nutrition, Novel Foods and Food Allergens (NDA); Turck D, Bohn T, Castenmiller J, de Henauw S, Hirsch-Ernst KI, Knutsen HK, Maciuk A, Mangelsdorf I, McArdle HJ, Naska A, Peláez C, Pentieva K, Thies F, Tsabouri S, Vinceti M, Bresson JL, Siani A. EFSA Panel on Nutrition, Novel Foods and Food Allergens (NDA), et al. EFSA J. 2022 Apr 19;20(4):e07259. doi: 10.2903/j.efsa.2022.7259. eCollection 2022 Apr. EFSA J. 2022. PMID: 35464873 Free PMC article. - Promising Sources of Plant-Derived Polyunsaturated Fatty Acids: A Narrative Review.
Rizzo G, Baroni L, Lombardo M. Rizzo G, et al. Int J Environ Res Public Health. 2023 Jan 17;20(3):1683. doi: 10.3390/ijerph20031683. Int J Environ Res Public Health. 2023. PMID: 36767052 Free PMC article. Review.
References
- World Health Organization. The world health report 1998. Life in the 21st century: a vision for all. WHO, 1998.
- Mozaffarian D, Wilson PW, Kannel WB. Beyond established and novel risk factors: lifestyle risk factors for cardiovascular disease. Circulation 2008;117:3031-8. - PubMed
- Lim SS, Vos T, Flaxman AD, Danaei G, Shibuya K, Adair-Rohani H, et al. A comparative risk assessment of burden of disease and injury attributable to 67 risk factors and risk factor clusters in 21 regions, 1990-2010: a systematic analysis for the Global Burden of Disease Study 2010. Lancet 2013;380:2224-60. - PMC - PubMed
Publication types
MeSH terms
Substances
Grants and funding
- G0801056/MRC_/Medical Research Council/United Kingdom
- R24 HD041020/HD/NICHD NIH HHS/United States
- R01-HD38700/HD/NICHD NIH HHS/United States
- 5 R24 HD050924/HD/NICHD NIH HHS/United States
LinkOut - more resources
Full Text Sources
Other Literature Sources
Medical


