Colony-stimulating factor 1 receptor signaling is necessary for microglia viability, unmasking a microglia progenitor cell in the adult brain - PubMed (original) (raw)
Colony-stimulating factor 1 receptor signaling is necessary for microglia viability, unmasking a microglia progenitor cell in the adult brain
Monica R P Elmore et al. Neuron. 2014.
Abstract
The colony-stimulating factor 1 receptor (CSF1R) is a key regulator of myeloid lineage cells. Genetic loss of the CSF1R blocks the normal population of resident microglia in the brain that originates from the yolk sac during early development. However, the role of CSF1R signaling in microglial homeostasis in the adult brain is largely unknown. To this end, we tested the effects of selective CSF1R inhibitors on microglia in adult mice. Surprisingly, extensive treatment results in elimination of ∼99% of all microglia brain-wide, showing that microglia in the adult brain are physiologically dependent upon CSF1R signaling. Mice depleted of microglia show no behavioral or cognitive abnormalities, revealing that microglia are not necessary for these tasks. Finally, we discovered that the microglia-depleted brain completely repopulates with new microglia within 1 week of inhibitor cessation. Microglial repopulation throughout the CNS occurs through proliferation of nestin-positive cells that then differentiate into microglia.
Copyright © 2014 Elsevier Inc. All rights reserved.
Figures
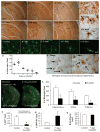
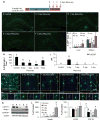
Figure 1. CSF1R inhibition eliminates microglia from the adult brain
12 month-old wild-type mice (C57BL/6/129 mix; n = 4–5 per group) were treated with PLX3397 (290 mg/kg chow) for 0, 1, 3, 7, 14, or 21 days. A–F) Immunostaining for IBA1 shows robust decreases in microglial numbers, with no detectable microglia present after 21 days of treatment. G–I) IBA1 immunostaining shows changes in microglia morphology during treatment, with representative microglia shown from control, 7-, and 21- days treated mice, imaged from between the blades of the dentate gyrus. J–N) Representative IBA1 immunofluorescent staining from the hippocampal region showing 63XZ-stacks of microglia during treatment. Scale bar represents 20 μM. O) Quantification of number of IBA1+ cell bodies from a 10X field of view from the hippocampal regions as a function of time. Statistical analyses were performed via one-way ANOVA indicating p <0.0001 for CA1, CA3, and subiculum, comparing all timepoints, shown as an average for all 3 regions. P, Q) IBA1+ cell debris and non-intact cell parts were observed throughout the brains of mice treated with CSF1R inhibitors. Arrows indicate these microglial remnants alongside intact microglia. R–S) 2 month-old CX3CR1-GFP+/− mice were treated with PLX3397 or vehicle for 3 days (n = 3 per group). Brains were sectioned and the number of GFP+ cell bodies counted from a 10X field of view of the hippocampus, cortex, and thalamus. Each white dot represents a GFP+ cell body. T) 2 month-old CX3CR1-GFP+/− mice were treated with PLX3397 for 7 days or vehicle (n = 3 per group). Brains were then extracted, dissociated into a single cell suspension, and then incubated with PI. Flow cytometry was then performed revealing >90% reduction in the number of GFP+ cells with treatment compared to vehicle treated. U) The fraction of GFP+ cells that were undergoing cell death, as shown by incorporation of PI, was significantly higher with PLX3397 treatment than vehicle, consistent with microglial cell death with CSF1R inhibition. V) Total brain volumes were measured via Cavalieri stereology in 2 month-old wild-type mice treated with PLX3397 or vehicle for 7 days (n = 4 per group). No significant differences were seen. * indicates significance (p <0.05) by unpaired students T-test. Erorr bars indicate SEM. CA, cornusammonis; DG, dentate gyrus; O, stratum oriens; R, stratum; M, molecular layer dentate gyrus; H, hilus.
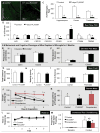
Figure 2. CSF1R inhibition reduces microglial markers and numbers, but does not affect brain volume, cognition, or motor function
A–D) 2 month-old wild-type mice were treated with PLX3397 for 7 days or vehicle (n = 4 per group). Representative images from brain sections stained with anti-IBA1 from the hippocampal region of control (A) and PLX3397 (B) treated mice. C) Quantification of the number of IBA1+ cell bodies in a 10X field of view from the hippocampus, cortex, and thalamus shows >90% elimination of microglia with 7 days PLX3397 treatment. D) Real Time PCR of mRNA extracted from half brains for microglial markers shows robust reductions in AIF1, CSF1R, CX3CR1, FCGR1, ITGAM, and TREM2. E–M) 2 month-old wild-type mice were treated for 2 months with PLX3397 or vehicle to deplete microglia from the CNS (n = 10 per group). E, F) Elevated plus maze showed no differences in the frequency of arm entries or time spent in the open or closed arms in microglia-depleted mice versus controls. G–I) Open field analysis showed no differences in the average total distance moved (G), the average velocity (H), or the relative amount of time spent at the edge of the arena versus the center (I) with microglial elimination. Combined, these two tasks demonstrate that mice depleted of microglia do not show increased anxiety. J, K) Microglia-depleted mice showed reduced escape latencies in the Barnes maze on days 2 and 3 of training compared to controls, as well as a lower average escape latency for all training sessions. Mice administered scopolamine (a cholinergic antagonist that causes memory deficits) performed more poorly than both controls and PLX3397-treated mice. L) Accelerating rotarod showed no changes in mice depleted of microglia. M) As expected, animals treated with scopolamine had reduced memory in a contextual fear conditioning paradigm, but there were no differences in time spent freezing for controls or microglia-depleted mice. * indicates significance (p <0.05) by unpaired students T-test, while same capital letters above conditions indicates no significant difference. For comparisons in (J): *p <0.05 = CON vs. PLX; †p <0.05 = CON + Scopolamine; p <0.05 = PLX vs. CON + Scopolamine.
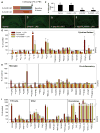
Figure 3. LPS challenge in microglia deficient brains
A) Schematic of the experimental design: 2 month-old C57BL/6 mice were fed either PLX3397 or control chow for 7 days. On day 7, mice were injected (IP) with either LPS (0.25 mg/kg) or PBS (n = 4 per group). Mice were euthanized 6 hours post-injection. B–E) Immunostaining for IBA1 shows robust decreases in microglial numbers for both PLX3397 and PLX3397 + LPS, which was confirmed by microglial counts (F). G–I) The relative mRNA expression of the microglia-devoid brain in response to LPS for a variety of inflammatory gene markers. Significance is dictated by the following symbols: Control vs. Control + LPS*; Control vs. PLX3397†; Control + LPS vs. PLX3397 + LPS#; PLX3397 vs. PLX3397 + LPS (all comparisons, p <0.05). Full p-values can be found in supplemental Table 1. Erorr bars indicate SEM.
Figure 4. Rapid repopulation of the microglia-depleted brain with new cells that differentiate into microglia
A) To explore microglia homeostasis in the adult brain, 18 month-old wild-type mice were treated with PLX3397 for 28 days to deplete microglia. The inhibitor was withdrawn and groups of mice sacrificed immediately and at 3, 7, 14, and 21 days later (n = 4–5 per group). B–G) IBA1 immunostaining revealed microglia throughout the untreated (control) brains (B) and elimination of microglia in mice treated with PLX3397 (C). New IBA1+ cells appeared throughout the CNS at the 3-day recovery timepoint with very different morphologies to control resident microglia (D). Cell numbers increased by the 7-day recovery timepoint and the morphology of the cells begin to resemble a more ramified state (E). By 14 (F) and 21 (G) days of recovery, the IBA1+ cells resemble ramified microglia and have fully repopulated the entire CNS. H) Quantification of the number of IBA1+ cells in the hippocampal field. I) Analysis of cell body size shows that IBA1+ cells at the 3-day recovery timepoint are much larger than resident microglia. The size of these cells then normalizes over the following recovery timepoints. J) Representative IBA1+ cells from each of the groups, showing the changes in cell morphology and size that occur during repopulation. K) Cells at the 3-day recovery timepoint express a number of unique markers, including CD45, nestin, Ki67, CD34, and c-kit. They also show high immunoreactivity to the IB4 lectin. Notably, IBA1+ cells in control brains and surviving IBA1+ cells in the 0-day recovery group are negative for all these markers. Likewise cells at the 7-, 14-, and 21-day recovery timepoints are also negative for all these markers, highlighting that the initial repopulating cells have a unique morphology and phenotype. Same capital letters above conditions indicates no significant difference (p>0.05) via one-way ANOVA with post-hoc Newman-Keuls Multiple Comparison Test. Error bars indicate SEM. Scale bars represents 20 μM.
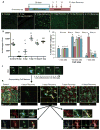
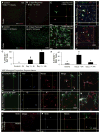
Figure 5. Microglial repopulation occurs between 48 and 72 hours after CSF1R inhibitor withdrawal
A) To investigate early repopulation events, 2 month-old CX3CR1-GFP+/− mice were treated with PLX3397 for 7 days. The inhibitor was then withdrawn and groups of mice sacrificed 1, 2, and 3 days later (n = 4 per group). B–F) Representative sections shown from the hippocampus of each of these groups, in which microglia express GFP. G) Flow cytometry of GFP+ cells from the liver and spleen of these animals. H) Quantification of whole brain sections for microglial numbers shows a reduction of ~70% with 7 days PLX3397 treatment. Microglial numbers continue to decline for 2 days after inhibitor withdrawal, but rapidly recover between days 2 and 3, highlighting a crucial time period in repopulation. I) Brain levels of PLX3397 show rapid clearance of the drug from the CNS. J) GFP+ cells strongly express nestin at the 2- and 3-day recovery timepoints. 63X Z-stacks obtained by confocal microscopy and maximal projections are shown. Scale bar represents 20 μM. Separate channels and merge are shown for each of the timepoints in the panels below. K) Western blots of whole brain homogenates show significant increases in nestin and CSF1R with repopulation, but no changes in CCR2. L) Quantification of K) normalized to GAPDH as a loading control. Same capital letters above conditions indicates no significance (p>0.05) via one-way ANOVA with post-hoc Newman-Keuls Multiple Comparison Test. Error bars indicate SEM.
Figure 6. Microglial repopulation is preceded by proliferation of a non-microglial cell type throughout the CNS
Using the same experimental groups as shown in Figure 5, A) repopulating brains were stained for the cell proliferation marker Ki67. Few Ki67+ cells were seen in control, 0-, or 1- day recovery groups. A fraction of the GFP+ cells expresses Ki67 at the 2-day recovery timepoint and a majority of the GFP+ cells express Ki67 at the 3-day recovery timepoint. Of note, Ki67+/GFP− cells appeared throughout the CNS at 2 days of recovery, usually with two nuclei adjacent to one another, suggesting a recent cell division (highlighted by arrows). Far fewer Ki67+/GFP− cells were seen at the 3-day recovery timepoint. 63X Z-stacks obtained by confocal microscopy and maximal projections are shown. Scale bar represents 20 μM. B) Images of Ki67+ and GFP+ cells from the cortex are shown to illustrate the number of proliferating, but GFP negative, cells that appear at the 2-day recovery timepoint, which is quantified in (C) for the hippocampal region, (D) for the piriform cortex, and (E) for the cortex. Same capital letters above conditions indicates no significant difference (p>0.05) via one-way ANOVA with post-hoc Newman-Keuls Multiple Comparison Test. Error bars indicate SEM.
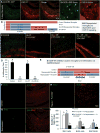
Figure 7. Fate mapping reveals a nestin-expressing microglia progenitor cell that becomes the repopulating microglia
A–C) To determine if the non-microglial Ki67+ proliferating cells were becoming microglia, 2 month-old wild-type mice were treated with PLX3397 or vehicle to deplete microglia. The inhibitor was withdrawn and BrdU administered 2 days later to label proliferating cells (n = 3–4 per group). Mice were sacrificed 5 or 24 hours later (n = 4 per group). Representative images of the cortical region are shown for controls (A) and the 2-day recovery group (B) for IBA1 and anti-BrdU at 5 hours following BrdU administration. 63X maximal projection Z-stacks are shown for the 2-day recovery group + 5 hours BrdU (C), revealing that the vast majority of BrdU-incorporated cells are not microglia. D–F) Representative images of the cortical region are shown for controls (D) and the 2-day recovery group (E) for IBA1 and anti-BrdU at 24 hours following BrdU administration. 63X maximal projection Z-stacks are shown for the 2-day recovery group at 24 hours following BrdU administration (F), revealing that the vast majority of BrdU-incorporated cells are now microglia. G) Quantification of A–F shows that only 30% of BrdU-incorporated cells are microglia after 5 hours, but 96% become microglia after 24 hours. H) Quantification of the total amount of BrdU+/non-microglial cells per field of view shows that most of these cells have differentiated into microglia within 24 hours. K, M) CX3CR1-GFP+/− mice were treated for 7 days with PLX3397, and 2 days after inhibitor withdrawal, Ki67+/GFP−/nestin+ cells are induced throughout the CNS (highlighted with white arrow heads; two different fields of view are shown, with a zoom image of the nestin expressing cells shown in L and N). In addition, co-stains with Ki67 show that the repopulating cells do not express GFAP (I) or MAP2 (J). O, P) BrdU-incorporated cells in the 2-day recovery brains (sections obtained from (B) above), also express nestin (microglia only shown in the 63X merge). Same capital letters above conditions indicates no significant difference (p>0.05) via one-way ANOVA with post-hoc Newman-Keuls Multiple Comparison Test. Error bars indicate SEM. Scale bars represents 20 μM.
Figure 8. Microglia are eliminated with CSF1R inhibition and not dedifferentiated
A) Repopulating microglia express CSF1R – 3-day recovery timepoint shown. B) Schematic of the experimental design: 2 month-old mice were treated for 21 days with PLX3397 to deplete microglia (“on”). PLX3397 was then removed from the diet in a second group and repopulation allowed for 14 days (“on-off”). A final group was then treated for a second time with PLX3397 (“on-off-on”, n = 4–5 per group) to determine if repopulated microglia were also eliminated with CSF1R inhibition. C) Representative sections from the hippocampal field for IBA1 and NeuN from each of the four groups. D) Quantification of IBA1 cells in matching full brain sections shows that repopulating microglia are also fully dependent upon CSF1R signaling. E) Schematic of the experimental design: 2 month-old wild-type mice were treated with PLX3397 for 7 days to deplete microglia. PLX3397 was removed to allow microglia to repopulate and BrdU was administered daily to tag these new cells. 7 days later, PLX3397 was re-administered to BrdU-tagged microglia containing mice. F–H) Representative stainings from the hippocampal region for BrdU and IBA1 show that repopulating microglia incorporate BrdU (G) and that PLX3397 treatment eliminates both IBA1 cells and BrdU-incorporated cells (H). I) Quantification of (F–H). Same capital letters above conditions indicates no significant differences (p>0.05) via one-way ANOVA. Error bars indicate SEM.
Comment in
- Hidden progenitors replace microglia in the adult brain.
Hughes EG, Bergles DE. Hughes EG, et al. Neuron. 2014 Apr 16;82(2):253-5. doi: 10.1016/j.neuron.2014.04.010. Neuron. 2014. PMID: 24742453
Similar articles
- An Early Microglial Response Is Needed To Efficiently Control Herpes Simplex Virus Encephalitis.
Uyar O, Laflamme N, Piret J, Venable MC, Carbonneau J, Zarrouk K, Rivest S, Boivin G. Uyar O, et al. J Virol. 2020 Nov 9;94(23):e01428-20. doi: 10.1128/JVI.01428-20. Print 2020 Nov 9. J Virol. 2020. PMID: 32938766 Free PMC article. - A limited capacity for microglial repopulation in the adult brain.
Najafi AR, Crapser J, Jiang S, Ng W, Mortazavi A, West BL, Green KN. Najafi AR, et al. Glia. 2018 Nov;66(11):2385-2396. doi: 10.1002/glia.23477. Epub 2018 Oct 28. Glia. 2018. PMID: 30370589 Free PMC article. - Proximal recolonization by self-renewing microglia re-establishes microglial homeostasis in the adult mouse brain.
Zhan L, Krabbe G, Du F, Jones I, Reichert MC, Telpoukhovskaia M, Kodama L, Wang C, Cho SH, Sayed F, Li Y, Le D, Zhou Y, Shen Y, West B, Gan L. Zhan L, et al. PLoS Biol. 2019 Feb 8;17(2):e3000134. doi: 10.1371/journal.pbio.3000134. eCollection 2019 Feb. PLoS Biol. 2019. PMID: 30735499 Free PMC article. - Emerging Roles for CSF-1 Receptor and its Ligands in the Nervous System.
Chitu V, Gokhan Ş, Nandi S, Mehler MF, Stanley ER. Chitu V, et al. Trends Neurosci. 2016 Jun;39(6):378-393. doi: 10.1016/j.tins.2016.03.005. Epub 2016 Apr 12. Trends Neurosci. 2016. PMID: 27083478 Free PMC article. Review. - The M-CSF receptor in osteoclasts and beyond.
Mun SH, Park PSU, Park-Min KH. Mun SH, et al. Exp Mol Med. 2020 Aug;52(8):1239-1254. doi: 10.1038/s12276-020-0484-z. Epub 2020 Aug 17. Exp Mol Med. 2020. PMID: 32801364 Free PMC article. Review.
Cited by
- Aging and CNS Myeloid Cell Depletion Attenuate Breast Cancer Brain Metastasis.
Wu AML, Gossa S, Samala R, Chung MA, Gril B, Yang HH, Thorsheim HR, Tran AD, Wei D, Taner E, Isanogle K, Yang Y, Dolan EL, Robinson C, Difilippantonio S, Lee MP, Khan I, Smith QR, McGavern DB, Wakefield LM, Steeg PS. Wu AML, et al. Clin Cancer Res. 2021 Aug 1;27(15):4422-4434. doi: 10.1158/1078-0432.CCR-21-1549. Epub 2021 Jun 3. Clin Cancer Res. 2021. PMID: 34083229 Free PMC article. - Deacetylase SIRT2 Inhibition Promotes Microglial M2 Polarization Through Axl/PI3K/AKT to Alleviate White Matter Injury After Subarachnoid Hemorrhage.
Yuan K, Wu Q, Yao Y, Shao J, Zhu S, Yang J, Sun Q, Zhao J, Xu J, Wu P, Li Y, Shi H. Yuan K, et al. Transl Stroke Res. 2024 Aug 5. doi: 10.1007/s12975-024-01282-5. Online ahead of print. Transl Stroke Res. 2024. PMID: 39103659 - Microglial depletion aggravates the severity of acute and chronic seizures in mice.
Wu W, Li Y, Wei Y, Bosco DB, Xie M, Zhao MG, Richardson JR, Wu LJ. Wu W, et al. Brain Behav Immun. 2020 Oct;89:245-255. doi: 10.1016/j.bbi.2020.06.028. Epub 2020 Jul 2. Brain Behav Immun. 2020. PMID: 32621847 Free PMC article. - The role of microglia and myeloid immune cells in acute cerebral ischemia.
Benakis C, Garcia-Bonilla L, Iadecola C, Anrather J. Benakis C, et al. Front Cell Neurosci. 2015 Jan 14;8:461. doi: 10.3389/fncel.2014.00461. eCollection 2014. Front Cell Neurosci. 2015. PMID: 25642168 Free PMC article. Review. - Glial Cells Promote Myelin Formation and Elimination.
Hughes AN. Hughes AN. Front Cell Dev Biol. 2021 May 11;9:661486. doi: 10.3389/fcell.2021.661486. eCollection 2021. Front Cell Dev Biol. 2021. PMID: 34046407 Free PMC article. Review.
References
- Ajami B, Bennett JL, Krieger C, McNagny KM, Rossi FM. Infiltrating monocytes trigger EAE progression, but do not contribute to the resident microglia pool. Nat Neurosci. 2011;14:1142–1149. - PubMed
- Artis DR, BR, Gillette S, Hurt CR, Ibrahim PL, Zuckerman RL. U.S. patent, editor. Molecular scaffolds for kinase ligand development. USA: Jul 28, 2005.
- Banisadr G, Gosselin RD, Mechighel P, Rostene W, Kitabgi P, Melik Parsadaniantz S. Constitutive neuronal expression of CCR2 chemokine receptor and its colocalization with neurotransmitters in normal rat brain: functional effect of MCP-1/CCL2 on calcium mobilization in primary cultured neurons. J Comp Neurol. 2005;492:178–192. - PubMed
- Beutner C, Roy K, Linnartz B, Napoli I, Neumann H. Generation of microglial cells from mouse embryonic stem cells. Nat Protoc. 2010;5:1481–1494. - PubMed
Publication types
MeSH terms
Substances
Grants and funding
- R01 NS083801/NS/NINDS NIH HHS/United States
- P01 AG000538/AG/NIA NIH HHS/United States
- 1R01NS083801/NS/NINDS NIH HHS/United States
- AG00538/AG/NIA NIH HHS/United States
- F31 NS086409/NS/NINDS NIH HHS/United States
- F31NS086409/NS/NINDS NIH HHS/United States
- T32 AG000096/AG/NIA NIH HHS/United States
- UL1TR000153/TR/NCATS NIH HHS/United States
LinkOut - more resources
Full Text Sources
Other Literature Sources
Molecular Biology Databases
Research Materials
Miscellaneous
