A general approach for haplotype phasing across the full spectrum of relatedness - PubMed (original) (raw)
. 2014 Apr 17;10(4):e1004234.
doi: 10.1371/journal.pgen.1004234. eCollection 2014 Apr.
Deepti Gurdasani 2, Olivier Delaneau 3, Nicola Pirastu 4, Sheila Ulivi 5, Massimiliano Cocca 6, Michela Traglia 6, Jie Huang 7, Jennifer E Huffman 8, Igor Rudan 9, Ruth McQuillan 9, Ross M Fraser 9, Harry Campbell 9, Ozren Polasek 10, Gershim Asiki 11, Kenneth Ekoru 12, Caroline Hayward 8, Alan F Wright 8, Veronique Vitart 8, Pau Navarro 8, Jean-Francois Zagury 12, James F Wilson 9, Daniela Toniolo 6, Paolo Gasparini 4, Nicole Soranzo 7, Manjinder S Sandhu 2, Jonathan Marchini 1
Affiliations
- PMID: 24743097
- PMCID: PMC3990520
- DOI: 10.1371/journal.pgen.1004234
A general approach for haplotype phasing across the full spectrum of relatedness
Jared O'Connell et al. PLoS Genet. 2014.
Abstract
Many existing cohorts contain a range of relatedness between genotyped individuals, either by design or by chance. Haplotype estimation in such cohorts is a central step in many downstream analyses. Using genotypes from six cohorts from isolated populations and two cohorts from non-isolated populations, we have investigated the performance of different phasing methods designed for nominally 'unrelated' individuals. We find that SHAPEIT2 produces much lower switch error rates in all cohorts compared to other methods, including those designed specifically for isolated populations. In particular, when large amounts of IBD sharing is present, SHAPEIT2 infers close to perfect haplotypes. Based on these results we have developed a general strategy for phasing cohorts with any level of implicit or explicit relatedness between individuals. First SHAPEIT2 is run ignoring all explicit family information. We then apply a novel HMM method (duoHMM) to combine the SHAPEIT2 haplotypes with any family information to infer the inheritance pattern of each meiosis at all sites across each chromosome. This allows the correction of switch errors, detection of recombination events and genotyping errors. We show that the method detects numbers of recombination events that align very well with expectations based on genetic maps, and that it infers far fewer spurious recombination events than Merlin. The method can also detect genotyping errors and infer recombination events in otherwise uninformative families, such as trios and duos. The detected recombination events can be used in association scans for recombination phenotypes. The method provides a simple and unified approach to haplotype estimation, that will be of interest to researchers in the fields of human, animal and plant genetics.
Conflict of interest statement
The authors have declared that no competing interests exist.
Figures
Figure 1. Examples of inferred haplotypes with true recombination events and SEs.
In each examples  ,
,  ,
,  and
and  denotes the two parental and child haplotypes and
  denotes the pattern of gene flow. Top: Correctly inferred haplotypes in a region of a true recombination event that causes a
  transition in the duo HMM. The other 4 examples in the figure add SEs to these true parental and child haplotypes. Middle left: addition of a SE in the child's haplotypes that causes a
  transition. Middle right: addition of a SE in the parent's haplotypes that causes a
  transition. Bottom left: addition of a SE in the parent's haplotypes at the site of the recombination event that causes the
  transition to be missed. Bottom right: addition of a SE in both the child's and parent's haplotypes at the same position that causes a
  transition.
Figure 2. Summary of IBD sharing in cohorts.
Left: The proportion of heterozygote sites phased by SLRP for all individuals (pink) and when individuals with close relatives ( ) are removed (blue). Right: The distributions of the average number of “surrogate” parents for each cohort when closely related pairs (
 ) are removed.
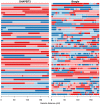
Figure 3. The duo HMM Viterbi paths for 50 father-child duos from the Val Borbera cohort on chromosome 10.
The four possible IBD states (A, B, C, D) are shown using colours pale blue, dark blue, light red and dark red respectively. The left and right panels show the results of the duo HMM applied to the SHAPEIT2 and Beagle haplotypes respectively. Changes between a blue and red colour correspond to a  or
or  transition, both of which imply a SE in the child. Changes of colour between light and dark blue or between light and dark red correspond to
  transitions, which correspond to a change on IBD state in the parent, and could be caused by a recombination or a SE in the parent. The x-axis shows the sex-averaged genetic distance across the chromosome in centiMorgans.
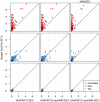
Figure 4. Switch error rates for individuals in extended pedigrees for different phasing pipelines across all European cohorts (chromosome 10).
Points are coloured according to what relationship was used by Beagle to phase that individual (red meaning no relationships were used). Left: Beagle using duo/trio phasing versus SHAPEIT2 using no relationships. Centre: Beagle using duo/trio phasing versus SHAPEIT2+duoHMM using no relationships. Right: Beagle using duo/trio phasing versus SHAPEIT2+duoHMM using no relationships when masking loci flagged as probable genotyping errors by the duoHMM. Switch error is reduced for both methods suggesting the masking is sensible.
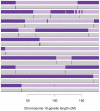
Figure 5. Inferred gene flow by Merlin (purple) and our method (grey) for ten informative meioses on chromosome 10 taken from Val Borbera cohort pedigrees.
The light and dark purple represent genetic material from the grand-paternal and grand-maternal chromosomes (as inferred by Merlin's Viterbi algorithm), hence changing from light to dark implies a a recombination event. The grey rectangles contain the posterior probability (in black) of recombination from our method. The two methods broadly agree, although Merlin has inferred a number of implausibly small cross over events.
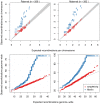
Figure 6. Distributions of the number of detected crossovers for all cohorts.
Only duos that were part of an informative pedigree were used. Top: The mean number of recombinations per meiosis (for all informative duos from all cohorts) found for each chromosome against the expected number (from the 2002 deCODE map) for paternal meioses (left) and maternal meioses (right). Merlin's values are substantially inflated whilst SHAPEIT2's are more consistent with the well known deCODE map genetic lengths. Bottom: Q-Q plots for the observed against expected number of recombinations estimated by each method for paternal meioses (left) and maternal meioses (right). For the expected distribution of recombination rates, a Poisson distribution using the genetic lengths from the 2002 deCODE Map was used (with rate parameter 42.81 and 25.9 for maternal and paternal recombinations respectively). SHAPEIT2's rates are less inflated than those of the Merlin.
Figure 7. Recombination detection accuracy in uninformative duos simulated from chromosome X data in the Val Borbera cohort.
The green values are for a cohort with nominally unrelated individuals and the orange values are for a cohort that has been filtered such that no individuals are closely related ( ). Left: The ROC curves for recombination detection in uninformative duos for our duo HMM using the SHAPEIT2 haplotypes. Right: The average number of correct detections against the average posterior probability. Setting a high probability threshold ensures a very low false discovery rate.
Similar articles
- HAPLORE: a program for haplotype reconstruction in general pedigrees without recombination.
Zhang K, Sun F, Zhao H. Zhang K, et al. Bioinformatics. 2005 Jan 1;21(1):90-103. doi: 10.1093/bioinformatics/bth388. Epub 2004 Jul 1. Bioinformatics. 2005. PMID: 15231536 - Detection of recombination events, haplotype reconstruction and imputation of sires using half-sib SNP genotypes.
Ferdosi MH, Kinghorn BP, van der Werf JH, Gondro C. Ferdosi MH, et al. Genet Sel Evol. 2014 Feb 4;46(1):11. doi: 10.1186/1297-9686-46-11. Genet Sel Evol. 2014. PMID: 24495596 Free PMC article. - Recombination locations and rates in beef cattle assessed from parent-offspring pairs.
Weng ZQ, Saatchi M, Schnabel RD, Taylor JF, Garrick DJ. Weng ZQ, et al. Genet Sel Evol. 2014 May 29;46(1):34. doi: 10.1186/1297-9686-46-34. Genet Sel Evol. 2014. PMID: 24885305 Free PMC article. - Efficient computation of minimum recombination with genotypes (not haplotypes).
Wu Y, Gusfield D. Wu Y, et al. J Bioinform Comput Biol. 2007 Apr;5(2a):181-200. doi: 10.1142/s0219720007002631. J Bioinform Comput Biol. 2007. PMID: 17589959 - Fast and Accurate Shared Segment Detection and Relatedness Estimation in Un-phased Genetic Data via TRUFFLE.
Dimitromanolakis A, Paterson AD, Sun L. Dimitromanolakis A, et al. Am J Hum Genet. 2019 Jul 3;105(1):78-88. doi: 10.1016/j.ajhg.2019.05.007. Epub 2019 Jun 6. Am J Hum Genet. 2019. PMID: 31178127 Free PMC article.
Cited by
- Ancestral Origins and Genetic History of Tibetan Highlanders.
Lu D, Lou H, Yuan K, Wang X, Wang Y, Zhang C, Lu Y, Yang X, Deng L, Zhou Y, Feng Q, Hu Y, Ding Q, Yang Y, Li S, Jin L, Guan Y, Su B, Kang L, Xu S. Lu D, et al. Am J Hum Genet. 2016 Sep 1;99(3):580-594. doi: 10.1016/j.ajhg.2016.07.002. Epub 2016 Aug 25. Am J Hum Genet. 2016. PMID: 27569548 Free PMC article. - A locus conferring tolerance to Theileria infection in African cattle.
Wragg D, Cook EAJ, Latré de Laté P, Sitt T, Hemmink JD, Chepkwony MC, Njeru R, Poole EJ, Powell J, Paxton EA, Callaby R, Talenti A, Miyunga AA, Ndambuki G, Mwaura S, Auty H, Matika O, Hassan M, Marshall K, Connelley T, Morrison LJ, Bronsvoort BMD, Morrison WI, Toye PG, Prendergast JGD. Wragg D, et al. PLoS Genet. 2022 Apr 21;18(4):e1010099. doi: 10.1371/journal.pgen.1010099. eCollection 2022 Apr. PLoS Genet. 2022. PMID: 35446841 Free PMC article. - Population history and genetic adaptation of the Fulani nomads: inferences from genome-wide data and the lactase persistence trait.
Vicente M, Priehodová E, Diallo I, Podgorná E, Poloni ES, Černý V, Schlebusch CM. Vicente M, et al. BMC Genomics. 2019 Dec 2;20(1):915. doi: 10.1186/s12864-019-6296-7. BMC Genomics. 2019. PMID: 31791255 Free PMC article. - Polygenic risk score identifies associations between sleep duration and diseases determined from an electronic medical record biobank.
Dashti HS, Redline S, Saxena R. Dashti HS, et al. Sleep. 2019 Mar 1;42(3):zsy247. doi: 10.1093/sleep/zsy247. Sleep. 2019. PMID: 30521049 Free PMC article. - Demographic history differences between Hispanics and Brazilians imprint haplotype features.
da Cruz PRS, Ananina G, Secolin R, Gil-da-Silva-Lopes VL, Lima CSP, de França PHC, Donatti A, Lourenço GJ, de Araujo TK, Simioni M, Lopes-Cendes I, Costa FF, de Melo MB. da Cruz PRS, et al. G3 (Bethesda). 2022 Jul 6;12(7):jkac111. doi: 10.1093/g3journal/jkac111. G3 (Bethesda). 2022. PMID: 35511163 Free PMC article.
References
- Delaneau O, Zagury JF, Marchini J (2013) Improved whole-chromosome phasing for disease and population genetic studies. Nature Methods 10: 5–6. - PubMed
- Delaneau O, Marchini J, Zagury J (2011) A linear complexity phasing method for thousands of genomes. Nature Methods 9: 179–181. - PubMed
Publication types
MeSH terms
Grants and funding
- CZB/4/710/CSO_/Chief Scientist Office/United Kingdom
- MC_PC_U127592696/MRC_/Medical Research Council/United Kingdom
- G0901213/MRC_/Medical Research Council/United Kingdom
- MC_PC_U127561128/MRC_/Medical Research Council/United Kingdom
- MR/K013491/1/MRC_/Medical Research Council/United Kingdom
- G0801823/MRC_/Medical Research Council/United Kingdom
- WT_/Wellcome Trust/United Kingdom
- 090058/Z/09/Z/WT_/Wellcome Trust/United Kingdom
LinkOut - more resources
Full Text Sources
Other Literature Sources


