Distinct profiles of myelin distribution along single axons of pyramidal neurons in the neocortex - PubMed (original) (raw)
Distinct profiles of myelin distribution along single axons of pyramidal neurons in the neocortex
Giulio Srubek Tomassy et al. Science. 2014.
Abstract
Myelin is a defining feature of the vertebrate nervous system. Variability in the thickness of the myelin envelope is a structural feature affecting the conduction of neuronal signals. Conversely, the distribution of myelinated tracts along the length of axons has been assumed to be uniform. Here, we traced high-throughput electron microscopy reconstructions of single axons of pyramidal neurons in the mouse neocortex and built high-resolution maps of myelination. We find that individual neurons have distinct longitudinal distribution of myelin. Neurons in the superficial layers displayed the most diversified profiles, including a new pattern where myelinated segments are interspersed with long, unmyelinated tracts. Our data indicate that the profile of longitudinal distribution of myelin is an integral feature of neuronal identity and may have evolved as a strategy to modulate long-distance communication in the neocortex.
Figures
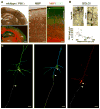
Fig. 1. Radial distribution of myelin in the adult mouse neocortex
(A) Immunohistochemical staining of MBP and CUX1 in coronal sections of wild type adult neocortex. High magnifications of boxed areas show reduced levels of myelin in layer II/III (brackets). (B) PMAS lengths (arrowheads) in Golgi-Cox-labeled adult wild type cortex. Top, representative neurons in layer II/III and layer V. Bottom, scatter plot of PMAS length versus distance of neuronal cell bodies from the pia (n=72, R2= 0.61093). (C) 3D renderings of three representative neurons. The green and blue neurons were located in layer III–IV and the red neuron was in layer V. Myelin is shown in white. Ctx, cortex; Hip, hippocampus, Th, thalamus. Scale bars, 500 μm (A, low magnification), 100 μm (A, insets), 20 μm (B), 25 μm (C).
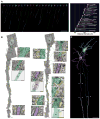
Fig. 2. Layer II/III pyramidal neurons display novel profiles of longitudinal myelination including intermittent myelin
(A) High-resolution rendering of myelin distribution along single axons of 22 pyramidal neurons traced and reconstructed in layer II/III of the V1 dataset. Right panel, soma position and lengths of axonal tracts for all neurons rendered in left panel. Magenta, neurons with intermittent myelin; blue, neurons with long PMAS; green, neurons with unmyelinated axons; white, myelinated axonal segments. (B) Representative, serial EM reconstructions of neurons with long PMAS (left) or intermittent myelin (right). Unmyelinated axon tracts are highlighted in green and myelinated tracts in magenta. Insets, EM images and schematic representations of selected regions from each axon. Yellow, selected synapses mapped on the intermittently myelinated axon. Ax, axon; Nu, nucleus, Psd, post-synaptic density. (C) High-resolution rendering of three representative neurons displaying different myelination modes. Native positions of these neurons are preserved in the rendering. Arrowheads mark the boundaries of myelinated tracts (white). Scale bars, 50 μm (A), 2 μm (B), 0.5 μm (B, insets), 20 μm (C).
Fig. 3. Longitudinal myelination profile is independent of neuron size and availability of oligodendrocyte progenitors
(A) Rendering and volumetric measurements of 283 pyramidal neurons across all layers of the S1 dataset. Soma size is color-coded with largest and smallest neurons rendered in orange and blue, respectively. Center, scatter plot of soma volumes versus distances from the pia. Top right, average values of the soma volumes measured in each cortical layer. Bottom right, scatter plot of PMAS lengths in layer V and VI versus cell body volumes. (B) Average values of soma volumes of 22 neurons from the V1 dataset, grouped according to their myelination profiles. (C) Top, immunohistochemistry for SOX10 and in situ hybridization for Pdgfrα in P14 wild type cortex. Right, quantification of OPCs distribution across layers. Bottom, in situ hybridization for Plp1 and immunohistochemistry for APC in adult wild type cortex. Right, quantification of OL distribution across layers. Error bars, mean±s.e.m. Ctx, cortex; wm, white matter; Str, striatum. Scale bars, 150 μm (A), 200 μm (C).
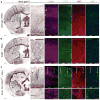
Fig. 4. Distribution of myelin depends on the laminar position of distinct classes of projection neurons
Histological staining of myelin by Black Gold (BG) II and immunohistochemistry for CUX1, CTIP2, MBP and APC in P28 cortex of wild type (A), Dab1−/− (B) and Emx1-Cre;RhoAfl/fl (C) mice. Immunohistochemistry for APC is on immediately consecutive sections. (C) Upper insets, deep layer neuron heterotopias and myelin distribution in normocortex. Lower insets, myelin deposition in the SBH. Ac, anterior commissure; Ctx, cortex; SBH, subcortical band heterotopia; Str, striatum; wm, white matter. Scale bars, 400 μm (A–C, lower magnification panels), 200 μm (A–C, insets).
Comment in
- Neuroscience. Myelin--more than insulation.
Fields RD. Fields RD. Science. 2014 Apr 18;344(6181):264-6. doi: 10.1126/science.1253851. Science. 2014. PMID: 24744365 Free PMC article. No abstract available. - Myelination: A not so even distribution.
Yates D. Yates D. Nat Rev Neurosci. 2014 Jun;15(6):351. doi: 10.1038/nrn3755. Epub 2014 May 9. Nat Rev Neurosci. 2014. PMID: 24810418 No abstract available.
Similar articles
- Individual Oligodendrocytes Show Bias for Inhibitory Axons in the Neocortex.
Zonouzi M, Berger D, Jokhi V, Kedaigle A, Lichtman J, Arlotta P. Zonouzi M, et al. Cell Rep. 2019 Jun 4;27(10):2799-2808.e3. doi: 10.1016/j.celrep.2019.05.018. Cell Rep. 2019. PMID: 31167127 Free PMC article. - Myelination: A not so even distribution.
Yates D. Yates D. Nat Rev Neurosci. 2014 Jun;15(6):351. doi: 10.1038/nrn3755. Epub 2014 May 9. Nat Rev Neurosci. 2014. PMID: 24810418 No abstract available. - Neuroscience. Myelin--more than insulation.
Fields RD. Fields RD. Science. 2014 Apr 18;344(6181):264-6. doi: 10.1126/science.1253851. Science. 2014. PMID: 24744365 Free PMC article. No abstract available. - Axon myelination. Myelination without myelin-associated glycoprotein.
Meyer-Franke A, Barres B. Meyer-Franke A, et al. Curr Biol. 1994 Sep 1;4(9):847-50. doi: 10.1016/s0960-9822(00)00190-1. Curr Biol. 1994. PMID: 7529638 Review. - [Development and maturation of the pyramidal tract].
Kubis N, Catala M. Kubis N, et al. Neurochirurgie. 2003 May;49(2-3 Pt 2):145-53. Neurochirurgie. 2003. PMID: 12746689 Review. French.
Cited by
- Preclinical Models of Encephalopathy of Prematurity.
Jantzie LL, Robinson S. Jantzie LL, et al. Dev Neurosci. 2015;37(4-5):277-88. doi: 10.1159/000371721. Epub 2015 Feb 18. Dev Neurosci. 2015. PMID: 25722056 Free PMC article. Review. - Reflective imaging of myelin integrity in the human and mouse central nervous systems.
Craig GA, Ryan L, Thapar J, McNamara NB, Hoffmann A, Page D, Rose J, Cox SR, Miron VE. Craig GA, et al. Front Cell Neurosci. 2024 Jul 10;18:1408182. doi: 10.3389/fncel.2024.1408182. eCollection 2024. Front Cell Neurosci. 2024. PMID: 39049821 Free PMC article. - Adolescence is associated with genomically patterned consolidation of the hubs of the human brain connectome.
Whitaker KJ, Vértes PE, Romero-Garcia R, Váša F, Moutoussis M, Prabhu G, Weiskopf N, Callaghan MF, Wagstyl K, Rittman T, Tait R, Ooi C, Suckling J, Inkster B, Fonagy P, Dolan RJ, Jones PB, Goodyer IM; NSPN Consortium; Bullmore ET. Whitaker KJ, et al. Proc Natl Acad Sci U S A. 2016 Aug 9;113(32):9105-10. doi: 10.1073/pnas.1601745113. Epub 2016 Jul 25. Proc Natl Acad Sci U S A. 2016. PMID: 27457931 Free PMC article. - Nerve-Glial antigen 2: unmasking the enigmatic cellular identity in the central nervous system.
Bottero M, Pessina G, Bason C, Vigo T, Uccelli A, Ferrara G. Bottero M, et al. Front Immunol. 2024 Jul 29;15:1393842. doi: 10.3389/fimmu.2024.1393842. eCollection 2024. Front Immunol. 2024. PMID: 39136008 Free PMC article. Review. - Motor learning drives dynamic patterns of intermittent myelination on learning-activated axons.
Bacmeister CM, Huang R, Osso LA, Thornton MA, Conant L, Chavez AR, Poleg-Polsky A, Hughes EG. Bacmeister CM, et al. Nat Neurosci. 2022 Oct;25(10):1300-1313. doi: 10.1038/s41593-022-01169-4. Epub 2022 Sep 30. Nat Neurosci. 2022. PMID: 36180791 Free PMC article.
References
- Baumann N, Pham-Dinh D. Physiol Rev. 2001;81:871. - PubMed
- Hildebrand C, Remahl S, Persson H, Bjartmar C. Prog Neurobiol. 1993;40:319. - PubMed
- Helmstaedter M, et al. Nature. 2013;500:168. - PubMed
- Lichtman JW, Denk W. Science. 2011;334:618. - PubMed
- Ramón y Cajal S. History of neuroscience. Oxford University Press; New York: 1995. Histology of the nervous system of man and vertebrates.
Publication types
MeSH terms
Grants and funding
- P50 MH094271/MH/NIMH NIH HHS/United States
- R01 NS062849/NS/NINDS NIH HHS/United States
- R01 NS078164/NS/NINDS NIH HHS/United States
- HHMI/Howard Hughes Medical Institute/United States
- NS062849/NS/NINDS NIH HHS/United States
- NS078164/NS/NINDS NIH HHS/United States
- U01 NS090449/NS/NINDS NIH HHS/United States
- R01 EB016411/EB/NIBIB NIH HHS/United States
- 1P50MH094271/MH/NIMH NIH HHS/United States
LinkOut - more resources
Full Text Sources
Other Literature Sources
Molecular Biology Databases


