Isolation and molecular characterization of circulating melanoma cells - PubMed (original) (raw)
. 2014 May 8;7(3):645-53.
doi: 10.1016/j.celrep.2014.03.039. Epub 2014 Apr 18.
Devarati Mitra 2, Ryan J Sullivan 3, Ben S Wittner 4, Anya M Kimura 4, Shiwei Pan 4, Mai P Hoang 5, Brian W Brannigan 4, Donald P Lawrence 3, Keith T Flaherty 3, Lecia V Sequist 3, Martin McMahon 6, Marcus W Bosenberg 7, Shannon L Stott 8, David T Ting 3, Sridhar Ramaswamy 3, Mehmet Toner 9, David E Fisher 10, Shyamala Maheswaran 11, Daniel A Haber 12
Affiliations
- PMID: 24746818
- PMCID: PMC4079008
- DOI: 10.1016/j.celrep.2014.03.039
Isolation and molecular characterization of circulating melanoma cells
Xi Luo et al. Cell Rep. 2014.
Abstract
Melanoma is an invasive malignancy with a high frequency of blood-borne metastases, but circulating tumor cells (CTCs) have not been readily isolated. We adapted microfluidic CTC capture to a tamoxifen-driven B-RAF/PTEN mouse melanoma model. CTCs were detected in all tumor-bearing mice and rapidly declined after B-RAF inhibitor treatment. CTCs were shed early from localized tumors, and a short course of B-RAF inhibition following surgical resection was sufficient to dramatically suppress distant metastases. The large number of CTCs in melanoma-bearing mice enabled a comparison of RNA-sequencing profiles with matched primary tumors. A mouse melanoma CTC-derived signature correlated with invasiveness and cellular motility in human melanoma. CTCs were detected in smaller numbers in patients with metastatic melanoma and declined with successful B-RAF-targeted therapy. Together, the capture and molecular characterization of CTCs provide insight into the hematogenous spread of melanoma.
Copyright © 2014 The Authors. Published by Elsevier Inc. All rights reserved.
Figures
Figure 1. Identification of CTCs in the B-RAFCA/+/PTENflox/flox mouse melanoma model
(A) Representative images of melanoma induced by focal tamoxifen injection. Arrowheads show tumor progression at the injection site from day 7 to day 24 (left) and cutaneous metastasis at day 56 after tumor induction (right). (B) Upper panel, representative image of a mouse melanoma CTC adjacent to a leukocyte. Lower panel, a cluster of four CTCs. DAPI, blue; CD45, green; S100, red; scale bars, 10μm. (C) Quantification of CTCs from a cohort of tumor-bearing (green, N=12) and control mice (red, genotype-matched tumor-free mice, N=8; blue, Tyr-CreER- mice received tamoxifen injection, N=5; open circles, syngeneic C57BL/6 mice, N=9). Solid lines, median CTC counts. Dashed line, threshold of ≥14 S100+ cells/ ml. Tam, tamoxifen. Concordant change in (D) tumor volume and (E) CTCs in tumor-bearing mice fed with control chow or PLX4720-containing chow are shown (PLX4720, blue; control, red) (Mean value, error bars represent standard deviation). (See also Figure S1)
Figure 2. Distant metastasis is associated with the presence of CTCs and is prevented by adjuvant B-RAF inhibition
(A) Tumor progression on 4-HT treated ear. (B) CTCs can be detected as early as day 7 after tumor induction and correspond to tumor progression. (C) CTC counts correlate with tumor thickness when thickness is greater than 0.1mm (N=12, R2=0.66). (D) Left panel, schematic diagram of the experimental procedures. Right panels, post-surgical administration of B-RAF inhibitor delays or prevents distant metastasis. After the affected ears were removed, the mice were fed with PLX4720-containing chow (N=17) or control chow (N=16) for 4 weeks. Subcutaneous metastases were observed in the control group (10 out of 16) but not in the PLX4720-fed group (0 out of 17). Tumors on the contralateral ear were also largely suppressed by PLX4720. (See also Figure S2)
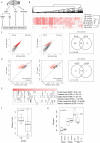
Figure 3. Digital Gene Expression (DGE) analysis of mouse CTCs
(A) Schematic diagram of the DGE experiment. RNA was extracted from Chip-enriched cells, matched primary and metastatic tumors and subjected to Helicos DGE analysis. (B) Unsupervised clustering of transcripts enriched in CTCs, primary and metastatic tumors from the two mice (BP-55 and BP-73) demonstrating distinct expression profiles of CTCs from those of the primary tumor and metastasis. (C) Genes upregulated in CTC-enriched population compared with mock IgG-enriched cells. There were 1055 (left) and 275 (middle) upregulated genes in samples BP-55 and BP-73, respectively, with an overlap of 200 genes (right, “CTC-common”). Of these 200 genes, 132 were specifically overexpressed in CTCs compared with the primary tumor (D, left) and 125 were overexpressed in CTCs compared with the metastasis (D, middle), with 118 genes found to be in common (D, right). (E) Gene Set Enrichment Analysis (GSEA) on the 132 CTC-specific genes identified a number of gene sets related to cancer. Red bar, the 132 genes ranked by expression level from high (left, dark red) to low (right, light red); black vertical lines, overlap of the 132 genes with known gene sets. Poola breast, Poola invasive breast cancer genes (Poola et al., 2005); Hoshida liver, Hoshida liver carcinoma genes (Hoshida et al., 2009); Delys thyroid, Delys papillary thyroid cancer genes (Delys et al., 2007); Schuetz breast, Schuetz ductal invasive breast cancer genes (Schuetz et al., 2006); Onken melanoma, Onken aggressive uveal melanoma genes (Onken et al., 2006); Alonso melanoma, Alonso metastatic melanoma genes (Alonso et al., 2007). (F) The 132 CTC-specific gene signature is associated with increased motility in melanoma cell lines (Jeffs et al., 2009). (G) The signature also showed a progressive increase from benign or atypical nevus to primary and metastatic lesions. Benign, benign nevus; Atypica, atypical nevus; in situ, melanoma in situ; Vertical, melanoma vertical growth phase; Met, metastatic melanoma; Lymph, melanoma lymph node metastasis; Cult., metastatic melanoma short-term culture (Smith et al., 2005). (See also Figure S3)
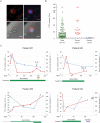
Figure 4. Detection and characterization of circulating tumor cells in melanoma patients
(A) Representative images of CTCs from patients with metastatic melanoma. CTCs are defined as being “melanoma stain (MEL)”+ and CD45−. Upper panels, IF image of a MEL+CD45− melanoma CTC. Lower panels, bright-field (BF) image and merged image IF and BF of a CTC reveals intracellular “granules” marked with arrowheads. MEL, CSPG4/MCAM/TYRP-1/αSMA antibody cocktail (upper panels) or CSPG4 (lower panels). DAPI, blue; MEL, red; scale bar, 10μm. (B) CTC counts of 174 samples from metastatic patients, 21 pre-treatment samples and 11 healthy donors. Median MEL(C/M/T/S)+/CD45− cell count is 8 cells/2.5ml for all patient samples, 24 cells/2.5ml for pre-treatment samples and 1 cells/2.5ml for controls. Solid lines, median CTC counts. Dashed line, threshold of ≥ 3 cells/2.5ml. (C) CTCs display dynamic changes in patients and correlate with therapy responses. Radiographic tumor measurement, blue curve; CTC counts, red curve. Br. M, brain metastasis; SRS, Stereotactic Radiosurgery; Discont., treatment discontinued; B-RAFi/MEKi, dabrafenib/trametinib (Patient M1, M3 and M4) or LGX818/MEK163 (Patient M2). (See also Figure S4)
Similar articles
- Usefulness of monitoring circulating tumor cells as a therapeutic biomarker in melanoma with BRAF mutation.
Kiniwa Y, Nakamura K, Mikoshiba A, Ashida A, Akiyama Y, Morimoto A, Okuyama R. Kiniwa Y, et al. BMC Cancer. 2021 Mar 17;21(1):287. doi: 10.1186/s12885-021-08016-y. BMC Cancer. 2021. PMID: 33731038 Free PMC article. - mRNA expression and BRAF mutation in circulating melanoma cells isolated from peripheral blood with high molecular weight melanoma-associated antigen-specific monoclonal antibody beads.
Kitago M, Koyanagi K, Nakamura T, Goto Y, Faries M, O'Day SJ, Morton DL, Ferrone S, Hoon DS. Kitago M, et al. Clin Chem. 2009 Apr;55(4):757-64. doi: 10.1373/clinchem.2008.116467. Epub 2009 Feb 20. Clin Chem. 2009. PMID: 19233913 Free PMC article. - Investigating circulating tumor cells and distant metastases in patient-derived orthotopic xenograft models of triple-negative breast cancer.
Ramani VC, Lemaire CA, Triboulet M, Casey KM, Heirich K, Renier C, Vilches-Moure JG, Gupta R, Razmara AM, Zhang H, Sledge GW, Sollier E, Jeffrey SS. Ramani VC, et al. Breast Cancer Res. 2019 Aug 28;21(1):98. doi: 10.1186/s13058-019-1182-4. Breast Cancer Res. 2019. PMID: 31462307 Free PMC article. - Nanostructure embedded microchips for detection, isolation, and characterization of circulating tumor cells.
Lin M, Chen JF, Lu YT, Zhang Y, Song J, Hou S, Ke Z, Tseng HR. Lin M, et al. Acc Chem Res. 2014 Oct 21;47(10):2941-50. doi: 10.1021/ar5001617. Epub 2014 Aug 11. Acc Chem Res. 2014. PMID: 25111636 Free PMC article. Review. - Circulating tumor cells as "liquid biopsies" to understand cancer metastasis.
Woo D, Yu M. Woo D, et al. Transl Res. 2018 Nov;201:128-135. doi: 10.1016/j.trsl.2018.07.003. Epub 2018 Jul 17. Transl Res. 2018. PMID: 30075099 Free PMC article. Review.
Cited by
- Circulating Melanoma Cell Numbers Correlate with TIGIT-Positive Cytotoxic T Cell Counts in Advanced-Stage Melanoma Patients.
Kamińska P, Buszka K, Galus Ł, Jankowski M, Nowicki M, Mackiewicz J, Kaczmarek M, Budna-Tukan J. Kamińska P, et al. Cells. 2023 Mar 9;12(6):856. doi: 10.3390/cells12060856. Cells. 2023. PMID: 36980196 Free PMC article. - Targeted agents and immunotherapies: optimizing outcomes in melanoma.
Luke JJ, Flaherty KT, Ribas A, Long GV. Luke JJ, et al. Nat Rev Clin Oncol. 2017 Aug;14(8):463-482. doi: 10.1038/nrclinonc.2017.43. Epub 2017 Apr 4. Nat Rev Clin Oncol. 2017. PMID: 28374786 Review. - Nanobiotechnology for the Therapeutic Targeting of Cancer Cells in Blood.
Li J, Sharkey CC, Huang D, King MR. Li J, et al. Cell Mol Bioeng. 2015;8(1):137-150. doi: 10.1007/s12195-015-0381-z. Epub 2015 Feb 24. Cell Mol Bioeng. 2015. PMID: 25798204 Free PMC article. - Adaptive Stress Responses During Tumor Metastasis and Dormancy.
Senft D, Ronai ZE. Senft D, et al. Trends Cancer. 2016 Aug;2(8):429-442. doi: 10.1016/j.trecan.2016.06.004. Trends Cancer. 2016. PMID: 27868104 Free PMC article. Review. - A Spontaneous Melanoma Mouse Model Applicable for a Longitudinal Chemotherapy and Immunotherapy Study.
Eddy K, Gupta K, Pelletier JC, Isola AL, Marinaro C, Rasheed MA, Campagnolo J, Eddin MN, Rossi M, Fateeva A, Reuhl K, Shah R, Robinson AK, Chaly A, Freeman KB, Chen W, Diaz J, Furmanski P, Silk AW, Reitz AB, Zloza A, Chen S. Eddy K, et al. J Invest Dermatol. 2023 Oct;143(10):2007-2018.e6. doi: 10.1016/j.jid.2023.03.1664. Epub 2023 Mar 29. J Invest Dermatol. 2023. PMID: 36997110 Free PMC article.
References
- Alonso SR, Tracey L, Ortiz P, Perez-Gomez B, Palacios J, Pollan M, Linares J, Serrano S, Saez-Castillo AI, Sanchez L, et al. A high-throughput study in melanoma identifies epithelial-mesenchymal transition as a major determinant of metastasis. Cancer Res. 2007;67:3450–3460. - PubMed
- Carrillo E, Prados J, Melguizo C, Marchal JA, Velez C, Serrano S, Boulaiz H, Merida JA, Aranega A. Reverse transcriptase-polymerase chain reaction detection of circulating tumor cells in patients with melanoma: correlation with clinical stage, tumor thickness and histological type. Pathol Int. 2002;52:294–299. - PubMed
Publication types
MeSH terms
Substances
Grants and funding
- R01 CA129933/CA/NCI NIH HHS/United States
- EB008047/EB/NIBIB NIH HHS/United States
- P01 CA163222/CA/NCI NIH HHS/United States
- R01 CA176839/CA/NCI NIH HHS/United States
- T32 GM007753/GM/NIGMS NIH HHS/United States
- CA129933/CA/NCI NIH HHS/United States
- R01 AR043369/AR/NIAMS NIH HHS/United States
- K12 CA087723/CA/NCI NIH HHS/United States
- HHMI_/Howard Hughes Medical Institute/United States
- U01 EB012493/EB/NIBIB NIH HHS/United States
- R01 EB008047/EB/NIBIB NIH HHS/United States
LinkOut - more resources
Full Text Sources
Other Literature Sources
Molecular Biology Databases
Research Materials
Miscellaneous


