Robustly detecting differential expression in RNA sequencing data using observation weights - PubMed (original) (raw)
Robustly detecting differential expression in RNA sequencing data using observation weights
Xiaobei Zhou et al. Nucleic Acids Res. 2014 Jun.
Abstract
A popular approach for comparing gene expression levels between (replicated) conditions of RNA sequencing data relies on counting reads that map to features of interest. Within such count-based methods, many flexible and advanced statistical approaches now exist and offer the ability to adjust for covariates (e.g. batch effects). Often, these methods include some sort of 'sharing of information' across features to improve inferences in small samples. It is important to achieve an appropriate tradeoff between statistical power and protection against outliers. Here, we study the robustness of existing approaches for count-based differential expression analysis and propose a new strategy based on observation weights that can be used within existing frameworks. The results suggest that outliers can have a global effect on differential analyses. We demonstrate the effectiveness of our new approach with real data and simulated data that reflects properties of real datasets (e.g. dispersion-mean trend) and develop an extensible framework for comprehensive testing of current and future methods. In addition, we explore the origin of such outliers, in some cases highlighting additional biological or technical factors within the experiment. Further details can be downloaded from the project website: http://imlspenticton.uzh.ch/robinson\_lab/edgeR\_robust/.
© The Author(s) 2014. Published by Oxford University Press on behalf of Nucleic Acids Research.
Figures
Figure 1.
From Pickrell (10) data, 10 randomly selected samples from individuals are divided into two groups of 5, forming an artificial ‘null’ scenario. (a), (b) and (c) show barplots of log-counts-per-million (CPMs) of three genes from the top 10 DE genes with one or two extremely large observations. Dashed lines represent group-wise average log-CPMs. (d) and (e) plot genewise biological coefficient of variation (BCV) against gene abundance (in log2 counts per million) for edgeR and DESeq. In panel (d), gray dots show unmoderated biological BCV estimates () (prior degrees of freedom = 0). Steel blue dots show moderated biological BCV with prior degree 10 (default setting for edgeR). Three outlier genes on (a), (b) and (c) are labeled by large blue dots. For (e), DESeq uses the maximum (steel blue dots) of a fitted dispersion-mean trend (red line) or the individual feature-wise (tagwise) dispersion estimate. Three outlier genes are also pointed out by large blue dots.
Figure 2.
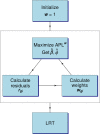
The flow chart of the robust algorithm implemented in edgeR. is the estimated GLM regression coefficient and
is the moderated dispersion estimate by maximizing APL
(Equation (10)). r gi is the Pearson residual corresponding to count y gi from Equation (7).
gi is the observation weight from Equation (8). LRT (glmLRT in edgeR) computes likelihood ratio tests using the weights.
Figure 3.
(a) For the random 5 versus 5 split of the Pickrell data (10) shown in Figure 1, the trajectories of overall trended dispersion and for the three individual genes are shown over six iterations of the edgeR-robust re-weighted estimation scheme. (b) A bar plot of miR-133b expression from Witten et al. (25), including an observation with very high count. (c) weights for miR-133b after six iterations of the re-estimation from edgeR-robust. Dashed lines in panel (b) shown the group-wise CPM before and after weighting.
Figure 4.
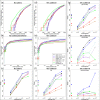
(a), (b) and (c) present FD, partial ROC (up to FP rate of 40%) and power plots (at each methods’ 5% FDR) across several tested methods for datasets with no introduced outliers; (d), (e) and (f) show corresponding plots with datasets containing 10% outliers (i.e. 10% of genes have a single outlier) using ‘S’ method. (g), (h) and (i) split the results from panel (f) into three categories: features without outliers (g); outliers in the higher expression group (h); outliers in the lower expression group (i). All power results are shown as overall (single dot on the left of the plot) and split across five equally-sized average-log-CPM groups. The X on panels (b) and (e) highlights the achieved power (TP) according to each method's 5% FDR cutoff. Note that while panel (g) presents the situation with no outliers, there are outliers present in other features within the dataset and is therefore different from panel (c).
Figure 5.
Power-to-achieved-FDR across hard (foldDiff ∈ [2, 2.2]), medium (foldDiff ∈ [3, 3.3]) and easy (foldDiff ∈ [6, 6.6]) simulation settings. (a) No outliers; (b) 10% outliers. Y-axis shows TP rate and X-axis shows FD rate. Five simulations are shown for each method and each setting. Points are taken according to each method's FDR cutoffs at 0.02, 0.05 and 0.1.
Figure 6.
Technical ((a) and (b)) and biological (c) sources of outlier genes. The number of down weighted observations (a) and distribution of outlier weights as a function of the gene GC% in three samples from the HapMap RNA-Seq data (10) are plotted (b). Two of the samples shown (NA11918 and NA12761) were shown by Hansen et al. to have strong, opposing relationships between GC% and mapped reads per kilobase per million reads (RPKM). The third sample (NA12156) had the least number of genes down weighted after applying our robust down weighting procedure. (c) The log(CPM) and the inverse of the down weighting value for genes in the ‘extracellular matrix’ gene ontology category, where a value of one indicates no down weighting and larger inverse weights indicate stronger down weighting.
Similar articles
- A comparison of per sample global scaling and per gene normalization methods for differential expression analysis of RNA-seq data.
Li X, Brock GN, Rouchka EC, Cooper NGF, Wu D, O'Toole TE, Gill RS, Eteleeb AM, O'Brien L, Rai SN. Li X, et al. PLoS One. 2017 May 1;12(5):e0176185. doi: 10.1371/journal.pone.0176185. eCollection 2017. PLoS One. 2017. PMID: 28459823 Free PMC article. - Robust identification of differentially expressed genes from RNA-seq data.
Shahjaman M, Manir Hossain Mollah M, Rezanur Rahman M, Islam SMS, Nurul Haque Mollah M. Shahjaman M, et al. Genomics. 2020 Mar;112(2):2000-2010. doi: 10.1016/j.ygeno.2019.11.012. Epub 2019 Nov 20. Genomics. 2020. PMID: 31756426 - Benchmarking RNA-seq differential expression analysis methods using spike-in and simulation data.
Baik B, Yoon S, Nam D. Baik B, et al. PLoS One. 2020 Apr 30;15(4):e0232271. doi: 10.1371/journal.pone.0232271. eCollection 2020. PLoS One. 2020. PMID: 32353015 Free PMC article. - LPEseq: Local-Pooled-Error Test for RNA Sequencing Experiments with a Small Number of Replicates.
Gim J, Won S, Park T. Gim J, et al. PLoS One. 2016 Aug 17;11(8):e0159182. doi: 10.1371/journal.pone.0159182. eCollection 2016. PLoS One. 2016. PMID: 27532300 Free PMC article. - RNA-Seq methods for transcriptome analysis.
Hrdlickova R, Toloue M, Tian B. Hrdlickova R, et al. Wiley Interdiscip Rev RNA. 2017 Jan;8(1):10.1002/wrna.1364. doi: 10.1002/wrna.1364. Epub 2016 May 19. Wiley Interdiscip Rev RNA. 2017. PMID: 27198714 Free PMC article. Review.
Cited by
- EpiMINE, a computational program for mining epigenomic data.
Jammula S, Pasini D. Jammula S, et al. Epigenetics Chromatin. 2016 Sep 29;9:42. doi: 10.1186/s13072-016-0095-z. eCollection 2016. Epigenetics Chromatin. 2016. PMID: 27708717 Free PMC article. - Porcine Fetal-Derived Fibroblasts Alter Gene Expression and Mitochondria to Compensate for Hypoxic Stress During Culture.
Mordhorst BR, Murphy SL, Schauflinger M, Rojas Salazar S, Ji T, Behura SK, Wells KD, Green JA, Prather RS. Mordhorst BR, et al. Cell Reprogram. 2018 Aug;20(4):225-235. doi: 10.1089/cell.2018.0008. Cell Reprogram. 2018. PMID: 30089028 Free PMC article. - Unveiling how vitrification affects the porcine blastocyst: clues from a transcriptomic study.
Almiñana C, Dubuisson F, Bauersachs S, Royer E, Mermillod P, Blesbois E, Guignot F. Almiñana C, et al. J Anim Sci Biotechnol. 2022 Mar 15;13(1):46. doi: 10.1186/s40104-021-00672-1. J Anim Sci Biotechnol. 2022. PMID: 35303969 Free PMC article. - Comparative Transcriptomic Analysis of Streptococcus thermophilus TH1436 and TH1477 Showing Different Capability in the Use of Galactose.
Giaretta S, Treu L, Vendramin V, da Silva Duarte V, Tarrah A, Campanaro S, Corich V, Giacomini A. Giaretta S, et al. Front Microbiol. 2018 Aug 7;9:1765. doi: 10.3389/fmicb.2018.01765. eCollection 2018. Front Microbiol. 2018. PMID: 30131781 Free PMC article. - Personalized Nutrition Using Microbial Metabolite Phenotype to Stratify Participants and Non-Invasive Host Exfoliomics Reveal the Effects of Flaxseed Lignan Supplementation in a Placebo-Controlled Crossover Trial.
Mullens DA, Ivanov I, Hullar MAJ, Randolph TW, Lampe JW, Chapkin RS. Mullens DA, et al. Nutrients. 2022 Jun 8;14(12):2377. doi: 10.3390/nu14122377. Nutrients. 2022. PMID: 35745107 Free PMC article. Clinical Trial.
References
- Anders S., McCarthy D.J., Chen Y., Okoniewski M., Smyth G.K., Huber W., Robinson M.D. Count-based differential expression analysis of RNA sequencing data using R and Bioconductor. Nat. Protocols. 2013;8:1765–1786. - PubMed
Publication types
MeSH terms
LinkOut - more resources
Full Text Sources
Other Literature Sources
Miscellaneous


