Mosaic loss of chromosome Y in peripheral blood is associated with shorter survival and higher risk of cancer - PubMed (original) (raw)
doi: 10.1038/ng.2966. Epub 2014 Apr 28.
Chiara Rasi 1, Niklas Malmqvist 2, Hanna Davies 1, Saichand Pasupulati 1, Geeta Pakalapati 1, Johanna Sandgren 3, Teresita Diaz de Ståhl 3, Ammar Zaghlool 1, Vilmantas Giedraitis 4, Lars Lannfelt 4, Joannah Score 5, Nicholas C P Cross 5, Devin Absher 6, Eva Tiensuu Janson 7, Cecilia M Lindgren 8, Andrew P Morris 9, Erik Ingelsson 10, Lars Lind 7, Jan P Dumanski 1
Affiliations
- PMID: 24777449
- PMCID: PMC5536222
- DOI: 10.1038/ng.2966
Mosaic loss of chromosome Y in peripheral blood is associated with shorter survival and higher risk of cancer
Lars A Forsberg et al. Nat Genet. 2014 Jun.
Abstract
Incidence and mortality for sex-unspecific cancers are higher among men, a fact that is largely unexplained. Furthermore, age-related loss of chromosome Y (LOY) is frequent in normal hematopoietic cells, but the phenotypic consequences of LOY have been elusive. From analysis of 1,153 elderly men, we report that LOY in peripheral blood was associated with risks of all-cause mortality (hazards ratio (HR) = 1.91, 95% confidence interval (CI) = 1.17-3.13; 637 events) and non-hematological cancer mortality (HR = 3.62, 95% CI = 1.56-8.41; 132 events). LOY affected at least 8.2% of the subjects in this cohort, and median survival times among men with LOY were 5.5 years shorter. Association of LOY with risk of all-cause mortality was validated in an independent cohort (HR = 3.66) in which 20.5% of subjects showed LOY. These results illustrate the impact of post-zygotic mosaicism on disease risk, could explain why males are more frequently affected by cancer and suggest that chromosome Y is important in processes beyond sex determination. LOY in blood could become a predictive biomarker of male carcinogenesis.
Conflict of interest statement
Competing Financial Interests
L.A.F and J.P.D has filed for a patent protecting the commercial applications of LOY for the assessment of cancer risk.
Figures
Figure 1
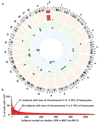
Structural genetic variants found in phenotypically normal blood cells from 1141 elderly men with no prior record of haematological malignancy. Circular-plot in panel a shows position and frequency of 40 autosomal variants including 13 deletions (red outer circle), 16 CNNLOH regions (green middle circle) and 11 gains (blue inner circle). The asterisk (*) above chromosome Y in panel a indicates that the frequency of loss of chromosome Y (LOY) is not shown to scale with the autosomal variants in panel a. Panel b shows the frequency of LOY, with the percentage of cells affected in each participant, plotted on the y-axis after sorting subjects with descending mLRR-Y, i.e. the median Log R Ratio (LRR) for ~2560 SNP-probes in the male specific region of chromosome Y (MSY) (chrY:2694521-59034049, hg19/GRCh37). The percentage of cells affected in each participant was calculated as described in Supplementary Figure 3. Solid line in panel b indicates the threshold of LOY used in the survival analyses and the dotted line shows the threshold for estimation of the frequency of LOY in the studied cohort.
Figure 2
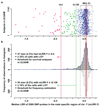
LOY frequency estimation after accounting for experimental variation. Panel a show the median Log R Ratio (LRR) in the male specific part of chromosome Y (mLRR-Y) observed in 1141 men with no history of haematological malignancies prior to blood sampling. Each triangle represents one participant. Panel b show the distribution of the mLRR-Y (grey bars) and the experimental noise (white bars) that were used to find the threshold for estimation of LOY frequency. The latter distribution was generated as described in methods. The dotted black lines represent the 99% confidence intervals (CI) of the distribution of expected experimental background noise (white bars). Among the 1141 men we found that 168 subjects (14.7%) had a lower median LRR than the lower 99% CI representing LOY in ~13.1% of cells. For the frequency of LOY reported here, we used the lowest value in the noise-distribution as threshold (green line at -0.139).
Figure 3
LOY and its effect on mortality. Panels a, b and c show impact of LOY on all-cause mortality, cancer mortality and mortality from non-haematological cancers, respectively, in 982 men with no history of cancer prior to sampling. Hazard ratios (HR), 95% confidence intervals (CI), number of events and p-values are shown for each model. Results are derived from Cox proportional hazards regression models, with subjects classified into groups 1 and 0 based on their level of LOY. Individuals in the affected group (red curves) had LOY in ≥35% of nucleated blood cells (Fig. 2).
Figure 4
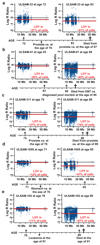
Longitudinal LOY analyses in five elderly men showing progressive accumulation of cells containing LOY with increasing age. Panels a-e show ULSAM subjects 33, 41, 311, 1655 and 102, respectively. Each subject was analyzed at two different ages and the lower part of each panel shows the time axis with genotyping ages, time point of cancer diagnosis and cancer type as well as age and cause of death, when applicable. The red line in each panel shows the median Log R Ratio of the male specific region of chromosome Y (mLRR-Y) as estimated from SNP-array experiments performed on blood collected at different ages in each subject. The text in red color indicates the estimated percentage of nucleated blood cells affected with LOY. This number was calculated using MAD-software from analysis of SNP-array data for the pseudoautosomal region 1 (PAR1) of chromosomes X/Y (see Supplementary Fig. 3 and Online Methods).
Similar articles
- Mosaic Loss of Chromosome Y in Blood Is Associated with Alzheimer Disease.
Dumanski JP, Lambert JC, Rasi C, Giedraitis V, Davies H, Grenier-Boley B, Lindgren CM, Campion D, Dufouil C; European Alzheimer’s Disease Initiative Investigators; Pasquier F, Amouyel P, Lannfelt L, Ingelsson M, Kilander L, Lind L, Forsberg LA. Dumanski JP, et al. Am J Hum Genet. 2016 Jun 2;98(6):1208-1219. doi: 10.1016/j.ajhg.2016.05.014. Epub 2016 May 23. Am J Hum Genet. 2016. PMID: 27231129 Free PMC article. Clinical Trial. - Loss of Y Chromosome in Peripheral Blood of Colorectal and Prostate Cancer Patients.
Noveski P, Madjunkova S, Sukarova Stefanovska E, Matevska Geshkovska N, Kuzmanovska M, Dimovski A, Plaseska-Karanfilska D. Noveski P, et al. PLoS One. 2016 Jan 8;11(1):e0146264. doi: 10.1371/journal.pone.0146264. eCollection 2016. PLoS One. 2016. PMID: 26745889 Free PMC article. - Mosaic loss of Y chromosome and mortality after coronary angiography.
Weyrich M, Zewinger S, Sarakpi T, Rasper T, Kleber ME, Cremer S, Zanders L, Fleck F, Siegbahn A, Wallentin L, Abplanalp WT, Nerbas L, Fay S, Eberle AL, Dimmeler S, März W, Speer T, Zeiher AM. Weyrich M, et al. Eur Heart J. 2025 May 2;46(17):1603-1616. doi: 10.1093/eurheartj/ehaf035. Eur Heart J. 2025. PMID: 39935193 Free PMC article. - Mosaic loss of human Y chromosome: what, how and why.
Guo X, Dai X, Zhou T, Wang H, Ni J, Xue J, Wang X. Guo X, et al. Hum Genet. 2020 Apr;139(4):421-446. doi: 10.1007/s00439-020-02114-w. Epub 2020 Feb 4. Hum Genet. 2020. PMID: 32020362 Review. - Loss of chromosome Y (LOY) in blood cells is associated with increased risk for disease and mortality in aging men.
Forsberg LA. Forsberg LA. Hum Genet. 2017 May;136(5):657-663. doi: 10.1007/s00439-017-1799-2. Epub 2017 Apr 19. Hum Genet. 2017. PMID: 28424864 Free PMC article. Review.
Cited by
- Male infertility and somatic health - insights into lipid damage as a mechanistic link.
Burke ND, Nixon B, Roman SD, Schjenken JE, Walters JLH, Aitken RJ, Bromfield EG. Burke ND, et al. Nat Rev Urol. 2022 Dec;19(12):727-750. doi: 10.1038/s41585-022-00640-y. Epub 2022 Sep 13. Nat Rev Urol. 2022. PMID: 36100661 Review. - Mosaic chromosomal alterations in hematopoietic cells and clinical outcomes in patients with multiple myeloma.
Husby S, Tulstrup M, Harsløf M, Nielsen C, Haastrup E, Ebbesen LH, Klarskov Andersen M, Pertesi M, Brieghel C, Niemann CU, Nilsson B, Szabo AG, Andersen NF, Abildgaard N, Vangsted A, Grønbæk K. Husby S, et al. Leukemia. 2024 Nov;38(11):2456-2465. doi: 10.1038/s41375-024-02396-3. Epub 2024 Sep 2. Leukemia. 2024. PMID: 39223296 Free PMC article. - Investigation of chromosome Y loss in men with schizophrenia.
Hirata T, Hishimoto A, Otsuka I, Okazaki S, Boku S, Kimura A, Horai T, Sora I. Hirata T, et al. Neuropsychiatr Dis Treat. 2018 Aug 20;14:2115-2122. doi: 10.2147/NDT.S172886. eCollection 2018. Neuropsychiatr Dis Treat. 2018. PMID: 30154659 Free PMC article. - Insights into the loss of the Y chromosome with age in control individuals and in patients with age-related macular degeneration using genotyping microarray data.
Grassmann F; International AMD Genomics Consortium (IAMDGC); Weber BHF, Veitia RA. Grassmann F, et al. Hum Genet. 2020 Mar;139(3):401-407. doi: 10.1007/s00439-019-02029-1. Epub 2019 May 27. Hum Genet. 2020. PMID: 31134332 - Mutagenesis. Smoking is associated with mosaic loss of chromosome Y.
Dumanski JP, Rasi C, Lönn M, Davies H, Ingelsson M, Giedraitis V, Lannfelt L, Magnusson PK, Lindgren CM, Morris AP, Cesarini D, Johannesson M, Tiensuu Janson E, Lind L, Pedersen NL, Ingelsson E, Forsberg LA. Dumanski JP, et al. Science. 2015 Jan 2;347(6217):81-3. doi: 10.1126/science.1262092. Epub 2014 Dec 4. Science. 2015. PMID: 25477213 Free PMC article.
References
- Edgren G, Liang L, Adami HO, Chang ET. Enigmatic sex disparities in cancer incidence. European journal of epidemiology. 2012;27:187–96. - PubMed
- Jacobs PA, Brunton M, Court Brown WM, Doll R, Goldstein H. Change of human chromosome count distribution with age: evidence for a sex differences. Nature. 1963;197:1080–1. - PubMed
- Pierre RV, Hoagland HC. Age-associated aneuploidy: loss of Y chromosome from human bone marrow cells with aging. Cancer. 1972;30:889–94. - PubMed
Publication types
MeSH terms
Substances
Grants and funding
- 090532/WT_/Wellcome Trust/United Kingdom
- 098017/WT_/Wellcome Trust/United Kingdom
- WT064890/WT_/Wellcome Trust/United Kingdom
- 086596/Z/08/Z/WT_/Wellcome Trust/United Kingdom
LinkOut - more resources
Full Text Sources
Other Literature Sources


