Sleep duration in midlife and later life in relation to cognition - PubMed (original) (raw)
. 2014 Jun;62(6):1073-81.
doi: 10.1111/jgs.12790. Epub 2014 May 1.
Affiliations
- PMID: 24786726
- PMCID: PMC4188530
- DOI: 10.1111/jgs.12790
Sleep duration in midlife and later life in relation to cognition
Elizabeth E Devore et al. J Am Geriatr Soc. 2014 Jun.
Abstract
Objectives: To evaluate associations between sleep duration at midlife and later life and change in sleep duration over time and cognition in older women.
Design: Participants reported sleep duration in 1986 and 2000, and a subgroup of older participants began cognitive testing in 1995 to 2001; follow-up testing was conducted three times, at 2-year intervals.
Setting: Prospective Nurses' Health Study cohort.
Participants: Female nurses aged 70 and older free of stroke and depression at the initial cognitive assessment (N = 15,385).
Measurements: Validated, telephone-based cognitive battery to measure cognitive function; four repeated assessments over 6 years were averaged to estimate overall cognition at older ages, and trajectories of cognitive change were evaluated over follow up.
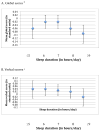
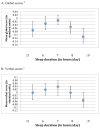
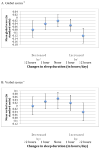
Results: Extreme sleep durations in later life were associated with worse average cognition (P < .001 for the quadratic term for a global score averaging all six cognitive tests). For example, women sleeping 5 h/d or less had worse global cognition than those sleeping 7 h/d, as did women sleeping 9 h/d or more; differences were equivalent to nearly 2 additional years of age. Associations were similar, although slightly attenuated, for sleep duration in midlife. Women whose sleep duration changed by 2 h/d or more over time had worse cognition than women with no change in sleep duration (e.g., for the global score, P < .001 for the quadratic term). Sleep duration was not associated with trajectories of cognitive function over 6 years, which might be attributable to short follow-up for detecting cognitive decline.
Conclusion: Extreme sleep durations at midlife and later life and extreme changes in sleep duration over time appear to be associated with poor cognition in older women.
Keywords: cognition; cohort study; epidemiology; sleep.
© 2014, Copyright the Authors Journal compilation © 2014, The American Geriatrics Society.
Conflict of interest statement
Conflict of interest: (To be determined by the editorial office based on COI information).
Figures
Figure 1
Means scores representing average cognition in later life across categories of sleep duration in midlife (reported in 1986) a a Estimates are adjusted for age (continuous), education (registered nurse, bachelor’s degree, graduate degree), shift work history (never, 1–9, 10–19, ≥20 years), smoking status (never, past, current), alcohol intake (none 1–14 grams/day, ≥15 grams/day, missing), physical activity (in quintiles of MET-hours/week, missing), body-mass index (<22, 22–24, 25–29, ≥30 kg/m2), history of high blood pressure (yes, no), mental health score on the SF-36 (poor, normal, missing), living alone (yes, no), and tranquilizer use (yes, no). b For each participant, the global score at each cognitive interview is calculated by averaging z-scores for each of the six tests in our cognitive battery. The mean global score representing average cognition in later life is further calculated by averaging global scores across repeated cognitive interviews for each participant. c For each participant, the verbal score at each cognitive interview is calculated by averaging z-scores for each of the four tests of verbal memory in our cognitive battery. The mean verbal score representing average cognition in later life is further calculated by averaging verbal scores across repeated cognitive interviews for each participant. d The mean TICS score representing average cognition in later life is calculated by averaging TICS scores across repeated cognitive interviews for each participant.
Figure 2
Mean scores representing average cognition in later life across categories of sleep duration in later life (reported in 2000) a a Estimates are adjusted for age (continuous), education (registered nurse, bachelor’s degree, graduate degree), shift work history (never, 1–9, 10–19, ≥20 years), smoking status (never, past, current), alcohol intake (none 1–14 grams/day, ≥15 grams/day, missing), physical activity (in quintiles of MET-hours/week, missing), body-mass index (<22, 22–24, 25–29, ≥30 kg/m2), history of high blood pressure (yes, no), mental health score on the SF-36 (poor, normal, missing), living alone (yes, no), and tranquilizer use (yes, no). b For each participant, the global score at each cognitive interview is calculated by averaging z-scores for each of the six tests in our cognitive battery. The mean global score representing average cognition in later life is further calculated by averaging global scores across repeated cognitive interviews for each participant. c For each participant, the verbal score at each cognitive interview is calculated by averaging z-scores for each of the four tests of verbal memory in our cognitive battery. The mean verbal score representing average cognition in later life is further calculated by averaging verbal scores across repeated cognitive interviews for each participant. d The mean TICS score representing average cognition in later life is calculated by averaging TICS scores across repeated cognitive interviews for each participant.
Figure 3
Mean scores representing average cognition in later life across categories of change in sleep duration from 1986 to 2000 a a Estimates are adjusted for age (continuous), education (registered nurse, bachelor’s degree, graduate degree), sleep duration in middle age (obtained in 1986) (≤5, 6, 7, 8, ≥9 hours/day), shift work history (never, 1–9, 10–19, ≥20 years), smoking status (never, past, current), alcohol intake (none 1–14 grams/day, ≥15 grams/day, missing), physical activity (in quintiles of MET-hours/week, missing), body-mass index (<22, 22–24, 25–29, ≥30 kg/m2), history of high blood pressure (yes, no), mental health score on the SF-36 (poor, normal, missing), living alone (yes, no), and tranquilizer use (yes, no). b For each participant, the global score at each cognitive interview is calculated by averaging z-scores for each of the six tests in our cognitive battery. The mean global score representing average cognition in later life is further calculated by averaging global scores across repeated cognitive interviews for each participant. c For each participant, the verbal score at each cognitive interview is calculated by averaging z-scores for each of the four tests of verbal memory in our cognitive battery. The mean verbal score representing average cognition in later life is further calculated by averaging verbal scores across repeated cognitive interviews for each participant. d The mean TICS score representing average cognition in later life is calculated by averaging TICS scores across repeated cognitive interviews for each participant.
Similar articles
- The association of self-reported sleep duration, difficulty sleeping, and snoring with cognitive function in older women.
Tworoger SS, Lee S, Schernhammer ES, Grodstein F. Tworoger SS, et al. Alzheimer Dis Assoc Disord. 2006 Jan-Mar;20(1):41-8. doi: 10.1097/01.wad.0000201850.52707.80. Alzheimer Dis Assoc Disord. 2006. PMID: 16493235 - Midlife sleep characteristics associated with late life cognitive function.
Virta JJ, Heikkilä K, Perola M, Koskenvuo M, Räihä I, Rinne JO, Kaprio J. Virta JJ, et al. Sleep. 2013 Oct 1;36(10):1533-41, 1541A. doi: 10.5665/sleep.3052. Sleep. 2013. PMID: 24082313 Free PMC article. - Association Between Sleep Quantity and Quality in Early Adulthood With Cognitive Function in Midlife.
Leng Y, Knutson K, Carnethon MR, Yaffe K. Leng Y, et al. Neurology. 2024 Jan 23;102(2):e208056. doi: 10.1212/WNL.0000000000208056. Epub 2024 Jan 3. Neurology. 2024. PMID: 38170947 Free PMC article. - Prolonged sleep duration as a predictor of cognitive decline: A meta-analysis encompassing 49 cohort studies.
Yang Q, Li S, Yang Y, Lin X, Yang M, Tian C, Mao J. Yang Q, et al. Neurosci Biobehav Rev. 2024 Sep;164:105817. doi: 10.1016/j.neubiorev.2024.105817. Epub 2024 Jul 18. Neurosci Biobehav Rev. 2024. PMID: 39032844 - Short sleep duration and dementia: a narrative review.
Stephens ER, Sarangi A, Gude J. Stephens ER, et al. Proc (Bayl Univ Med Cent). 2022 Jan 31;35(3):328-331. doi: 10.1080/08998280.2022.2026123. eCollection 2022. Proc (Bayl Univ Med Cent). 2022. PMID: 35518790 Free PMC article. Review.
Cited by
- Sleep Disturbances, Changes in Sleep, and Cognitive Function in Low-Income African Americans.
Troxel WM, Haas A, Dubowitz T, Ghosh-Dastidar B, Butters MA, Gary-Webb TL, Weinstein AM, Rosso AL. Troxel WM, et al. J Alzheimers Dis. 2022;87(4):1591-1601. doi: 10.3233/JAD-215530. J Alzheimers Dis. 2022. PMID: 35527545 Free PMC article. - Both short and long sleep durations are associated with cognitive impairment among community-dwelling Chinese older adults.
Ding G, Li J, Lian Z. Ding G, et al. Medicine (Baltimore). 2020 Mar;99(13):e19667. doi: 10.1097/MD.0000000000019667. Medicine (Baltimore). 2020. PMID: 32221096 Free PMC article. - A pilot time-in-bed restriction intervention behaviorally enhances slow-wave activity in older adults.
Wilckens KA, Habte RF, Dong Y, Stepan ME, Dessa KM, Whitehead AB, Peng CW, Fletcher ME, Buysse DJ. Wilckens KA, et al. Front Sleep. 2024;2:1265006. doi: 10.3389/frsle.2023.1265006. Epub 2024 Jan 2. Front Sleep. 2024. PMID: 38938690 Free PMC article. - Association Between Pre-Stroke Subjective Sleep Status and Post-Stroke Cognitive Impairment: A Nationwide Multi-Center Prospective Registry.
Zhang JL, Wang AX, Yang Y, Xu Q, Liao XL, Ma WG, Zhang N, Wang CX, Wang YJ. Zhang JL, et al. Nat Sci Sleep. 2022 Nov 2;14:1977-1988. doi: 10.2147/NSS.S378743. eCollection 2022. Nat Sci Sleep. 2022. PMID: 36349065 Free PMC article. - Daytime Sleepiness and Sleep Inadequacy as Risk Factors for Dementia.
Tsapanou A, Gu Y, Manly J, Schupf N, Tang MX, Zimmerman M, Scarmeas N, Stern Y. Tsapanou A, et al. Dement Geriatr Cogn Dis Extra. 2015 Jul 10;5(2):286-95. doi: 10.1159/000431311. eCollection 2015 May-Aug. Dement Geriatr Cogn Dis Extra. 2015. PMID: 26273244 Free PMC article.
References
- Schoenborn CA, Adams PE. Health behaviors of adults: United States, 2005–2007. Vital Health Stat. 2010;10:1–132. - PubMed
- Cappuccio FP, Cooper D, D’Elia L, Strazzullo P, Miller MA. Sleep duration predicts cardiovascular outcomes: a systematic review and meta-analysis of prospective studies. Eur Heart J. 2011;32:1484–1492. - PubMed
Publication types
MeSH terms
LinkOut - more resources
Full Text Sources
Other Literature Sources


