Drosha promotes splicing of a pre-microRNA-like alternative exon - PubMed (original) (raw)
Drosha promotes splicing of a pre-microRNA-like alternative exon
Mallory A Havens et al. PLoS Genet. 2014.
Abstract
The ribonuclease III enzyme Drosha has a central role in the biogenesis of microRNA (miRNA) by binding and cleaving hairpin structures in primary RNA transcripts into precursor miRNAs (pre-miRNAs). Many miRNA genes are located within protein-coding host genes and cleaved by Drosha in a manner that is coincident with splicing of introns by the spliceosome. The close proximity of splicing and pre-miRNA biogenesis suggests a potential for co-regulation of miRNA and host gene expression, though this relationship is not completely understood. Here, we describe a cleavage-independent role for Drosha in the splicing of an exon that has a predicted hairpin structure resembling a Drosha substrate. We find that Drosha can cleave the alternatively spliced exon 5 of the eIF4H gene into a pre-miRNA both in vitro and in cells. However, the primary role of Drosha in eIF4H gene expression is to promote the splicing of exon 5. Drosha binds to the exon and enhances splicing in a manner that depends on RNA structure but not on cleavage by Drosha. We conclude that Drosha can function like a splicing enhancer and promote exon inclusion. Our results reveal a new mechanism of alternative splicing regulation involving a cleavage-independent role for Drosha in splicing.
Conflict of interest statement
The authors have declared that no competing interests exist.
Figures
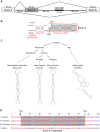
Figure 1. eIF4h exon 5 structure and conservation.
(A) Organization of the eIF4H gene region from exon 4 to 6. Boxes represent exons and horizontal lines are introns. Diagonal lines show alternative splicing pathways. The thick line within intron 5 represents miR-590. The number of nucleotides (nts) for each region of the gene is included. (B) The sequence and predicted structure of human eIF4H exon 5 (shaded in gray) and flanking intronic sequences are shown. The putative pre-miRNA sequence is outlined with a red line. Sequences reported to promote Microprocessor substrate recognition and specificity are noted including the upstream U at position −14 nts and a potential SRSF3 binding site (CNNC) at position +18 nts relative to the exon 5 splice sites. The 5′ (5′ss) and 3′ (3′ss) splice sites are shown with arrows. (C) A simplified phylogenetic tree depicting the conservation of exon 5 in several diverse species (above) and the corresponding predicted folded sequences of the exonic regions (below). (D) Sequence conservation of exon 5 and the flanking intronic regions. Red indicates nucleotide conservation across all four species. Blue indicates conservation in two or more species. Black indicates that the nucleotide is not conserved. Dashes represent gaps. The gray box refers to the exonic sequences.
Figure 2. The Microprocessor and Dicer cleave eIF4H exon 5 in vitro.
In vitro transcribed, radiolabelled eIF4H exon 5 or control RNAs were incubated with immunopurified FLAG-GFP (GFP), FLAG-Drosha or the transdominant negative version (TN Drosha), FLAG-DGCR8 and FLAG-Dicer or the transdominant negative version (TN Dicer), or whole cell extract. The canonical miRNAs, miR-96 (lanes 1–6) and miR-590 (lanes 13–18), are positive controls and the microprocessor-independent miRNA, mirtron miR-877 (lanes 19–24), located in host gene ABCF1, exon 7 from SMN1 (lanes 25–30) and exon 8 from APP (lanes 31–36), are negative controls. eIF4H exon 5 is shown (lanes 7–12). Grey boxes indicate exons, black lines indicate introns, red lines indicate known miRNA sequences. Molecular weight marker sizes are indicated on the right. The different RNA species are labeled on the left. Template RNA was loaded as a size marker (RNA, lanes 1, 7, 13, 19, 25, 31).
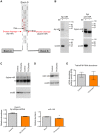
Figure 3. Exon 5 is cleaved from RNA in vitro and in cells.
(A) RNA products isolated from a region of the gel from Figure 2 corresponding to RNAs migrating between 30–80 nts in length were subjected to 5′ and 3′ RACE. Red arrows indicate 5′ and 3′ ends that were identified through sequencing of cleaved RNA products that represent the 5′ end and 3′ ends of putative 5p and 3p miRNAs, respectively. Black arrows indicate the 5′ and 3′ splice sites (ss). Bases outlined in red indicate a putative Dicer cleavage product as predicted by PhDCleav . The gray shading in the RNA structure represents exon 5. (B) Radiolabelled, stem-loop RT-PCR analysis of total cellular RNA, with (+) or without (−) reverse transcriptase, using stem-loop primers specific to the ends detected by sequencing of 3′ RACE products, or predicted by PHDCleav. SnoRNA65 (sno65) is a control, indicating the specific detection of RNA products. The stem-loop primer adds 38 nts to the amplicons, thus the 5p-miR and 3p/pre-miR are ∼36 nts and ∼27 nts, respectively, without the stem-loop. Molecular weight marker sizes are shown on the right. (C) Radiolabelled stem-loop RT-PCR analysis of exon 5 3p/pre-miR (n = 2) or (D) miR-126 (n = 3) in RNA isolated from HEK-293T control cells or cells transiently transfected with TN Drosha. Sno65 is a loading control. The graphs show the relative abundance of exon 5 3p/pre-miR and miR-126 RNA (miR/sno65). • indicates primer dimers. (E) eIF4H overall abundance as determined by Taqman qRT-PCR. Relative RNA quantity (RQ) was calculated using the ΔΔCt method where β-actin was the control, n = 6. In all cases, * indicates statistical significance determined by the Student's t-test where p≤0.05. Error bars represent standard error of the mean (SEM).
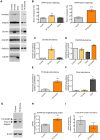
Figure 4. Drosha enhances exon 5 splicing.
(A) Radiolabelled RT-PCR analysis of endogenous eIF4H splicing, and expression of Drosha, DGCR8, DICER and a loading control, GAPDH, in HEK-293T control cells or following transfection with Drosha, Dicer or TN Drosha. (B) Quantitation of exon 5 splicing. The graphs show the percent of exon 5 splicing [included/(included+skipped)*100]; TN Drosha n = 9; Drosha and Dicer n = 3. The lower graphs show quantitation of (C) Drosha (D) DGCR8 (E) TN Drosha and (F) DICER abundance following overexpression, relative to GAPDH, n = 3. (G) Immunoblot of EIF4H protein isoform expression in the absence (control) or presence of TN Drosha expression in HEK-293T cells. (H) The graph shows the ratio of isoform expression (full length/skipped), n = 4. (I) The graph shows the overall protein expression of EIF4H [(Full Length+Skipped)/β-actin], n = 4. * p≤0.05, ** p≤0.005, *** p≤0.0005 indicate statistical significance by Student's t-test, All error bars represent SEM.
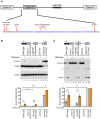
Figure 5. Exon 5 structure and splice sites affect the Drosha-mediated splicing enhancement.
(A) A wild-type eIF4H minigene, containing exons 4–6 and the intervening introns, was mutated at the indicated positions to generate constructs with an improved pyrimidine (Py) tract, mutated 3′ and 5′ splice sites (Δ3′ss and 5′ss) or a disrupted secondary structure (ΔStructure). Blue, black and red letters designate exon 5, intronic sequences and mutations, respectively. (B) Radiolabelled RT-PCR analysis of minigene-derived eIF4H mRNA exons 4–6 (C) or exons 4–5 from HEK-293T cells transiently transfected with minigenes and with (+) or without TN Drosha (−). Primer locations are shown on the minigene maps above the gel images. Graphs show the percent of exon 5 splicing [included/(included+skipped)*100] or [spliced/(spliced+unspliced)*100]. * indicates statistical significance by Student's t-test. Values of p≤0.05 were considered significant. • indicates an uncharacterized band. Error bars represent SEM. For control-treated cells, n = 6. For TN Drosha treated cells, n = 3.
Figure 6. eIF4H exon 5 co-immunoprecipitates with Drosha and TN Drosha.
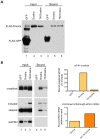
(A) An immunoblot of the FLAG-tagged proteins present in the input (lanes 1–3) and bound to the anti-FLAG M2 magnetic beads (Sigma) (bound, lanes 4–6). (B) Radiolabelled RT-PCR analysis of eIF4H unspliced RNA and mRNA in the input fraction (lanes 1–3) and bound to FLAG-tagged proteins (lanes 4–6) from HEK-293T cell lysates that were transiently transfected with eIF4H WT minigene and FLAG-tagged GFP (control), Drosha, or TN Drosha. GAPDH is a negative control. The top graph (eIF4H unspliced) shows the percent of unspliced RNA that was bound to the FLAG-tagged proteins, corrected for dilutions of Input relative to bound samples [bound/(input * dilution correction factor)]. The bottom graph shows the enrichment of exon 5 splicing in the bound fraction relative to input [(included/skipped)bound/(included/skipped* dilution correction factor)input]. Drosha values are an average of two independent experiments.
Figure 7. Drosha enhances exon 5 splicing directly.
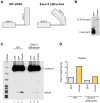
(A) The wild-type (WT) or Exon 5 ΔStructure minigenes templates that were used to generate RNA for the in vitro splicing assay are shown with the predicted exon 5 structures. Boxes represent exons and lines are introns. The red line in the ΔStructure mutant indicates the nucleotides that were mutated. (B) Immunoblot of FLAG-tagged GFP and Drosha that bound to anti-FLAG M2 magnetic beads (Sigma) and were used in the in vitro splicing assays. (C) Radiolabelled RT-PCR analysis of the RNA produced from in vitro splicing reactions of WT and Exon 5 ΔStructure RNA. RNA species (spliced and unspliced) are indicated. Splicing reactions were carried out in HeLa nuclear extracts in the absence of ATP (-ATP, lanes 1 and 4), or in the presence of ATP and supplemented with FLAG-tagged GFP (lanes 2 and 5), or Drosha (lanes 3 and 6). (D) Graph shows the percent of exon 5 splicing [spliced/(spliced+unspliced)*100].
Similar articles
- DROSHA targets its own transcript to modulate alternative splicing.
Lee D, Nam JW, Shin C. Lee D, et al. RNA. 2017 Jul;23(7):1035-1047. doi: 10.1261/rna.059808.116. Epub 2017 Apr 11. RNA. 2017. PMID: 28400409 Free PMC article. - Alternative splicing regulates biogenesis of miRNAs located across exon-intron junctions.
Melamed Z, Levy A, Ashwal-Fluss R, Lev-Maor G, Mekahel K, Atias N, Gilad S, Sharan R, Levy C, Kadener S, Ast G. Melamed Z, et al. Mol Cell. 2013 Jun 27;50(6):869-81. doi: 10.1016/j.molcel.2013.05.007. Epub 2013 Jun 6. Mol Cell. 2013. PMID: 23747012 - Mirtrons: microRNA biogenesis via splicing.
Westholm JO, Lai EC. Westholm JO, et al. Biochimie. 2011 Nov;93(11):1897-904. doi: 10.1016/j.biochi.2011.06.017. Epub 2011 Jun 21. Biochimie. 2011. PMID: 21712066 Free PMC article. Review. - Microprocessor-dependent processing of splice site overlapping microRNA exons does not result in changes in alternative splicing.
Pianigiani G, Licastro D, Fortugno P, Castiglia D, Petrovic I, Pagani F. Pianigiani G, et al. RNA. 2018 Sep;24(9):1158-1171. doi: 10.1261/rna.063438.117. Epub 2018 Jun 12. RNA. 2018. PMID: 29895677 Free PMC article. - Versatile microRNA biogenesis in animals and their viruses.
Xie M, Steitz JA. Xie M, et al. RNA Biol. 2014;11(6):673-81. doi: 10.4161/rna.28985. Epub 2014 May 7. RNA Biol. 2014. PMID: 24823351 Free PMC article. Review.
Cited by
- Emerging roles of DROSHA beyond primary microRNA processing.
Lee D, Shin C. Lee D, et al. RNA Biol. 2018 Feb 1;15(2):186-193. doi: 10.1080/15476286.2017.1405210. Epub 2017 Dec 12. RNA Biol. 2018. PMID: 29171328 Free PMC article. - Translational Regulation by hnRNP H/F Is Essential for the Proliferation and Survival of Glioblastoma.
Le Bras M, Gorelick N, Pautet S, Tyler B, Manenti S, Skuli N, Millevoi S, Cammas A. Le Bras M, et al. Cancers (Basel). 2022 Mar 2;14(5):1283. doi: 10.3390/cancers14051283. Cancers (Basel). 2022. PMID: 35267591 Free PMC article. - Survey of the binding preferences of RNA-binding proteins to RNA editing events.
Hu X, Zou Q, Yao L, Yang X. Hu X, et al. Genome Biol. 2022 Aug 4;23(1):169. doi: 10.1186/s13059-022-02741-8. Genome Biol. 2022. PMID: 35927743 Free PMC article. - Overview of MicroRNA Biogenesis, Mechanisms of Actions, and Circulation.
O'Brien J, Hayder H, Zayed Y, Peng C. O'Brien J, et al. Front Endocrinol (Lausanne). 2018 Aug 3;9:402. doi: 10.3389/fendo.2018.00402. eCollection 2018. Front Endocrinol (Lausanne). 2018. PMID: 30123182 Free PMC article. Review. - High Glucose Treatment Limits Drosha Protein Expression and Alters AngiomiR Maturation in Microvascular Primary Endothelial Cells via an Mdm2-dependent Mechanism.
Lam B, Nwadozi E, Haas TL, Birot O, Roudier E. Lam B, et al. Cells. 2021 Mar 27;10(4):742. doi: 10.3390/cells10040742. Cells. 2021. PMID: 33801773 Free PMC article.
References
- Denli AM, Tops BB, Plasterk RH, Ketting RF, Hannon GJ (2004) Processing of primary microRNAs by the Microprocessor complex. Nature 432: 231–235. - PubMed
- Gregory RI, Yan KP, Amuthan G, Chendrimada T, Doratotaj B, et al. (2004) The Microprocessor complex mediates the genesis of microRNAs. Nature 432: 235–240. - PubMed
- Landthaler M, Yalcin A, Tuschl T (2004) The human DiGeorge syndrome critical region gene 8 and Its D. melanogaster homolog are required for miRNA biogenesis. Curr Biol 14: 2162–2167. - PubMed
- Lee Y, Ahn C, Han J, Choi H, Kim J, et al. (2003) The nuclear RNase III Drosha initiates microRNA processing. Nature 425: 415–419. - PubMed
Publication types
MeSH terms
Substances
Grants and funding
- F31 NS076237/NS/NINDS NIH HHS/United States
- S10 OD010662/OD/NIH HHS/United States
- NS069759/NS/NINDS NIH HHS/United States
- 1F31NS076237/NS/NINDS NIH HHS/United States
- NCRR S10 OD010662/OD/NIH HHS/United States
- C76HF03610-01-00/PHS HHS/United States
- R01 NS069759/NS/NINDS NIH HHS/United States
LinkOut - more resources
Full Text Sources
Other Literature Sources
