Mitochondria modify exercise-induced development of stem cell-derived neurons in the adult brain - PubMed (original) (raw)
Mitochondria modify exercise-induced development of stem cell-derived neurons in the adult brain
Kathrin Steib et al. J Neurosci. 2014.
Abstract
Neural stem cells in the adult mammalian hippocampus continuously generate new functional neurons, which modify the hippocampal network and significantly contribute to cognitive processes and mood regulation. Here, we show that the development of new neurons from stem cells in adult mice is paralleled by extensive changes to mitochondrial mass, distribution, and shape. Moreover, exercise-a strong modifier of adult hippocampal neurogenesis-accelerates neuronal maturation and induces a profound increase in mitochondrial content and the presence of mitochondria in dendritic segments. Genetic inhibition of the activity of the mitochondrial fission factor dynamin-related protein 1 (Drp1) inhibits neurogenesis under basal and exercise conditions. Conversely, enhanced Drp1 activity furthers exercise-induced acceleration of neuronal maturation. Collectively, these results indicate that adult hippocampal neurogenesis requires adaptation of the mitochondrial compartment and suggest that mitochondria are targets for enhancing neurogenesis-dependent hippocampal plasticity.
Keywords: Activity; adult hippocampal neurogenesis; exercise; mitochondria; stem cells.
Figures
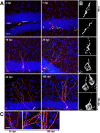
Figure 1.
Mitochondrial morphology and localization during the development of adult-generated DG neurons. A, Development of adult-born neurons (red) is paralleled by increase in mitochondria mass (mitochondria in green). Scale bar, 25 μm. B, Higher magnification reveals distinct morphologies of somatic mitochondria. At early stages, mitochondria predominantly formed large tubular structures. Between 16 and 42 dpi, mitochondria were of a mixed tubular and globular shape. At 106 dpi, mitochondria in some adult-generated neurons formed an interconnected network. Note the dense packing of the dendritic shaft with mitochondria at all developmental time points. Scale bar, 3 μm. C, Higher magnification of the dendritic mitochondria at 16, 28, and 106 dpi reveals an increasing presence of round mitochondria. Scale bar, 8 μm.
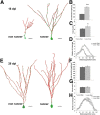
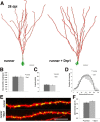
Figure 2.
Running accelerates dendritic development and transiently increases mitochondrial mass and dendritic mitochondrial content. A, Reconstruction of 16 dpi neurons in mice housed under control conditions (nonrunners) and mice with access to running wheels. Mitochondria in green, dendrites in red. Scale bar, 20 μm. B–D, Comparison of the dendritic parameters total dendritic length (B), branch points (C), and Sholl analysis (D) in 16 dpi neurons between mice housed under control conditions (control 16 dpi) and mice with access to running wheels (runner 16 dpi). E, Reconstruction of 28 dpi neurons in mice housed under control conditions (nonrunners) and mice with access to running wheels. Mitochondria, Green; dendrites, red. Scale bar, 20 μm. F–H, Comparison of the dendritic parameters total dendritic length (F), branch points (G), and Sholl analysis (H) in 28 dpi neurons between mice housed under control conditions (control 28 dpi) and mice with access to running wheels (runner 28 dpi). Data are given as the mean ± SEM. Error bars represent the SEM.
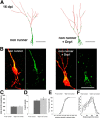
Figure 3.
Drp1 overexpression does not alter dendrite morphology of newborn neurons in nonrunning animals. A, Reconstruction of 16 dpi neurons in mice housed under control conditions. Control neuron is shown on the left (nonrunner), Drp1-transduced neuron is shown on the right. Mitochondria, green; dendrites, red. Scale bar, 20 μm. B, Higher magnification of mitochondria (green) in the soma and dendritic shaft of control and Drp1 retrovirus-transduced cells (red). Note the increased presence of fragmented mitochondria in Drp1-transduced cells. Scale bar, 20 μm. C–F, Comparison of the dendritic parameters total dendritic length (C), branch points (D), maximum extension index (E), and Sholl analysis (F) in control and Drp1-overexpressing 16 dpi neurons. Data are given as the mean ± SEM. Error bars represent the SEM.
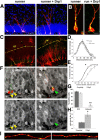
Figure 4.
Drp1 overexpression accelerates running-induced maturation. A, Overexpression of Drp1 promotes dendritic growth in 16 dpi neurons in the context of running. Control neurons are shown on the left (runner), and Drp1-overexpressing neurons in the running condition are shown on the right (runner + Drp1). Drp1-overexpressing neurons are identified by coexpression of mitochondria-targeted fluorescent protein (green). DAPI, Blue. Scale bar, 25 μm. B, Higher magnification of mitochondria (green) in control and Drp1 retrovirus-transduced cells (red). Note the increased presence of globular-shaped mitochondria, the reduction in mitochondria in the soma and dendritic shaft, and the globular shape of mitochondria in the dendritic arbor of Drp1-transduced cells. Scale bar, 10 μm. C, Drp1-overexpressing neurons show enhanced dendritic extension toward the hippocampal fissure. Drp1-overexpressing neurons are identified by coexpression of mitochondria-targeted fluorescent protein (green). Scale bar, 100 μm. D, E, Sholl analysis plot (D) and comparative cumulative distribution plot (E) of the maximum dendrite extension index of 16 dpi neurons in running only conditions (control) and running + Drp1 overepxression conditions (Drp1). *p < 0.05. F, The 16 dpi neurons (in red) in running-only conditions are negative for the mature neuronal marker calbindin (gray, yellow arrowheads). A significant fraction of Drp1-overexpressing neurons express calbindin (green arrowheads). Mitochondria, Green. Scale bar, 15 μm. G, Quantification of expression of the immature neuronal marker DCX and calbindin in 16 dpi neurons. H, I, Drp1 overepression increases spine density in 16 dpi neurons in running mice. Scale bar, 10 μm. Data are given as the mean ± SEM. Error bars represent the SEM.
Figure 5.
Drp1 overexpression does not permanently alter dendrite morphology and spine density. A, Reconstruction of 28 dpi neurons in mice with access to running wheels in the absence (runner) and presence (runner + Drp1) of Drp1 overexpression. Mitochondria, Green; dendrites, red. Scale bar, 20 μm. B–D, Comparison of the dendritic parameters total dendritic length (B), branch points (C), and Sholl analysis (D) in 28 dpi neurons between mice with access to running wheels in the absence (control) and presence (Drp1) of Drp1 overexpression. E, F, Comparison of spinogenesis in 28 dpi neurons between mice with access to running wheels in the absence (control) and presence (Drp1) of Drp1 overexpression. E, Mitochondria, Green. Scale bar, 10 μm. Data are given as the mean ± SEM. Error bars represent the SEM.
Figure 6.
Effects of dnDrp1 expression on neurogenesis under basal conditions and in the context of voluntary exercise. A, Under basal conditions, control transduced 8 dpi neurons show polarized morphology and start to grow a primary dendrite toward the molecular cell layer (white arrow). dnDrp1-expressing cells (red arrowhead) showed stunted morphology and limited mitochondrial content (in green). Cells in the same animal, which were transduced only with the control RFP-encoding retrovirus (white arrowhead), grow a primary dendrite toward the molecular cell layer. Scale bar, 15 μm. B, Comparison of the ratio between all mitoGFP-positive cells (green + yellow) to RFP-only cells (red) under nonrunning conditions. Note that the ratio decreases between 8 and 16 dpi in dnDrp1 retrovirus-injected animals. C, Running conditions: control-transduced 16 dpi neurons express the immature neuronal marker DCX (in blue; white arrow). dnDrp1-expressing cells frequently fail to express DCX and extend processes parallel to the subgranular zone (red arrowhead). Note the long tubular mitochondrial morphology. dnDrp1-expressing cells, which are positive for DCX, only grow short dendrites toward the molecular cell layer (white arrowhead). Note that mitochondria are confined to the soma. Scale bar, 15 μm. D, Quantification of transduced cells expressing DCX at 16 dpi under running conditions. E, Quantification of transduced cells bearing a primary dendrite spanning the granule cell layer at 16 dpi under running conditions. Error bars represent the SEM.
Similar articles
- Ganglioside GD3 regulates dendritic growth in newborn neurons in adult mouse hippocampus via modulation of mitochondrial dynamics.
Tang FL, Wang J, Itokazu Y, Yu RK. Tang FL, et al. J Neurochem. 2021 Mar;156(6):819-833. doi: 10.1111/jnc.15137. Epub 2020 Aug 13. J Neurochem. 2021. PMID: 32743804 Free PMC article. - Genetic influences on exercise-induced adult hippocampal neurogenesis across 12 divergent mouse strains.
Clark PJ, Kohman RA, Miller DS, Bhattacharya TK, Brzezinska WJ, Rhodes JS. Clark PJ, et al. Genes Brain Behav. 2011 Apr;10(3):345-53. doi: 10.1111/j.1601-183X.2010.00674.x. Epub 2011 Jan 12. Genes Brain Behav. 2011. PMID: 21223504 Free PMC article. - Physical exercise increases Notch activity, proliferation and cell cycle exit of type-3 progenitor cells in adult hippocampal neurogenesis.
Brandt MD, Maass A, Kempermann G, Storch A. Brandt MD, et al. Eur J Neurosci. 2010 Oct;32(8):1256-64. doi: 10.1111/j.1460-9568.2010.07410.x. Epub 2010 Oct 8. Eur J Neurosci. 2010. PMID: 20950279 - Mitochondria in Developmental and Adult Neurogenesis.
Arrázola MS, Andraini T, Szelechowski M, Mouledous L, Arnauné-Pelloquin L, Davezac N, Belenguer P, Rampon C, Miquel MC. Arrázola MS, et al. Neurotox Res. 2019 Aug;36(2):257-267. doi: 10.1007/s12640-018-9942-y. Epub 2018 Sep 13. Neurotox Res. 2019. PMID: 30215161 Review. - Mechanisms underlying the effect of voluntary running on adult hippocampal neurogenesis.
Gao Y, Syed M, Zhao X. Gao Y, et al. Hippocampus. 2023 Apr;33(4):373-390. doi: 10.1002/hipo.23520. Epub 2023 Mar 9. Hippocampus. 2023. PMID: 36892196 Free PMC article. Review.
Cited by
- MiRNA-137-mediated modulation of mitochondrial dynamics regulates human neural stem cell fate.
Channakkar AS, Singh T, Pattnaik B, Gupta K, Seth P, Adlakha YK. Channakkar AS, et al. Stem Cells. 2020 May;38(5):683-697. doi: 10.1002/stem.3155. Epub 2020 Feb 8. Stem Cells. 2020. PMID: 32012382 Free PMC article. - Stress and Psychiatric Disorders: The Role of Mitochondria.
Daniels TE, Olsen EM, Tyrka AR. Daniels TE, et al. Annu Rev Clin Psychol. 2020 May 7;16:165-186. doi: 10.1146/annurev-clinpsy-082719-104030. Epub 2020 Feb 24. Annu Rev Clin Psychol. 2020. PMID: 32092280 Free PMC article. Review. - How the Body Talks to the Brain; Peripheral Mediators of Physical Activity-Induced Proliferation in the Adult Hippocampus.
Bolijn S, Lucassen PJ. Bolijn S, et al. Brain Plast. 2015 Oct 9;1(1):5-27. doi: 10.3233/BPL-150020. Brain Plast. 2015. PMID: 29765833 Free PMC article. Review. - NR2F1 shapes mitochondria in the mouse brain, providing new insights into Bosch-Boonstra-Schaaf optic atrophy syndrome.
Bonzano S, Dallorto E, Molineris I, Michelon F, Crisci I, Gambarotta G, Neri F, Oliviero S, Beckervordersandforth R, Lie DC, Peretto P, Bovetti S, Studer M, De Marchis S. Bonzano S, et al. Dis Model Mech. 2023 Jun 1;16(6):dmm049854. doi: 10.1242/dmm.049854. Epub 2023 Jun 26. Dis Model Mech. 2023. PMID: 37260288 Free PMC article. - Physical exercise-induced hippocampal neurogenesis and antidepressant effects are mediated by the adipocyte hormone adiponectin.
Yau SY, Li A, Hoo RL, Ching YP, Christie BR, Lee TM, Xu A, So KF. Yau SY, et al. Proc Natl Acad Sci U S A. 2014 Nov 4;111(44):15810-5. doi: 10.1073/pnas.1415219111. Epub 2014 Oct 20. Proc Natl Acad Sci U S A. 2014. PMID: 25331877 Free PMC article.
References
- Beckervordersandforth R, Tripathi P, Ninkovic J, Bayam E, Lepier A, Stempfhuber B, Kirchhoff F, Hirrlinger J, Haslinger A, Lie DC, Beckers J, Yoder B, Irmler M, Götz M. In vivo fate mapping and expression analysis reveals molecular hallmarks of prospectively isolated adult neural stem cells. Cell Stem Cell. 2010;7:744–758. doi: 10.1016/j.stem.2010.11.017. - DOI - PubMed
Publication types
MeSH terms
Substances
LinkOut - more resources
Full Text Sources
Other Literature Sources
Research Materials
Miscellaneous
