Prospective identification and purification of quiescent adult neural stem cells from their in vivo niche - PubMed (original) (raw)
Prospective identification and purification of quiescent adult neural stem cells from their in vivo niche
Paolo Codega et al. Neuron. 2014.
Abstract
Adult neurogenic niches harbor quiescent neural stem cells; however, their in vivo identity has been elusive. Here, we prospectively isolate GFAP(+)CD133(+) (quiescent neural stem cells [qNSCs]) and GFAP(+)CD133(+)EGFR(+) (activated neural stem cells [aNSCs]) from the adult ventricular-subventricular zone. aNSCs are rapidly cycling, highly neurogenic in vivo, and enriched in colony-forming cells in vitro. In contrast, qNSCs are largely dormant in vivo, generate olfactory bulb interneurons with slower kinetics, and only rarely form colonies in vitro. Moreover, qNSCs are Nestin negative, a marker widely used for neural stem cells. Upon activation, qNSCs upregulate Nestin and EGFR and become highly proliferative. Notably, qNSCs and aNSCs can interconvert in vitro. Transcriptome analysis reveals that qNSCs share features with quiescent stem cells from other organs. Finally, small-molecule screening identified the GPCR ligands, S1P and PGD2, as factors that actively maintain the quiescent state of qNSCs.
Copyright © 2014 Elsevier Inc. All rights reserved.
Figures
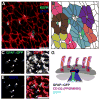
Figure 1. Two populations of CD133+ V-SVZ astrocytes contact the ventricle
(A–B) A subset of GFAP+ cells at the center of pinwheels express EGFR. (A) Confocal image of a whole mount immunostained for β-Catenin (red) to visualize pinwheels, GFAP (blue) and EGFR (green). (B) Schematic representation of whole mount shown in A. Individual pinwheels are highlighted in different colors and EGFR expressing cells are green. (C–F) Optical slice of a confocal Z-stack at the ventricular surface of a whole mount showing endogenous GFP expression GFP under the control of the human GFAP promoter (C) and immunostained for CD133 (D) and EGFR (E). (F) Merged image. Note that astrocytes contacting the ventricle with diffuse CD133 staining are EGFR+ (arrowheads), whereas those with CD133 restricted to the primary cilium are EGFR− (arrow). (G) Schema showing Type B1 astrocytes contacting the ventricle at the center of a pinwheel structure formed by ependymal cells (grey). CD133 (Prominin, magenta) is detected on the cilia of ependymal cells, some primary cilia of some Type B1 astrocytes (blue) and is diffusely expressed on the apical surface of EGFR+ Type B1 astrocytes (cyan). Scale bars: 30 μm. See also Figure S1 and S2.
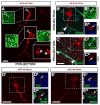
Figure 2. Both quiescent and activated CD133+ V-SVZ astrocytes have radial morphology and contact the ventricle and blood vessels
(A) Confocal images of whole mounts immunostained with β-Catenin (green) showing cells labeled by in vivo electroporation of the mP2-mCherry construct (red). Labeled cells are either radial cells that contact the ventricle at the center of pinwheels (open arrowheads in insets) or ependymal cells (asterisks). (B–C) Confocal images of whole mounts immunostained with Laminin (cyan), β-Catenin (green) and MCM2 (blue) showing projections of mP2-mCherry+ cells (BI and CI). Insets show superficial (BII and CII) and deep (BIII and CIII) optical slices. Both MCM2− (B) and MCM2+ (C) cells contact the ventricle at the center of pinwheels as well as blood vessels. (D–E) Confocal images of whole mounts immunostained with MCM2 (cyan) and β-Catenin (blue) and labeled with EGF-A647 (green) showing projections of mP2-mCherry+ cells (DI and EI). Insets show superficial (DII and EII) and deep (DIII and EIII) optical slices. Note that EGF negative cells are MCM2−. Scale bars: 30 μm. See also Figure S3.
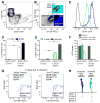
Figure 3. Prospectively purified CD133+ astrocyte subpopulations exhibit different cell cycle properties
(A–B) Representative FACS plots showing the gate used to select GFAP::GFP+CD24− cells (A), which are then gated on EGF-A647 and CD133-PE-Cy7. (B) Three populations are clearly defined: GFAP::GFP+ (grey), GFAP::GFP+CD133+ (blue) and GFAP::GFP+CD133+EGFR+ (cyan). See supplementary data for controls and other gating details (Figure S4). (C) Histogram showing the intensity of GFP signal in GFAP::GFP+, GFAP::GFP+CD133+ and GFAP::GFP+CD133+EGFR+ populations (grey, blue and cyan respectively) compared to other V-SVZ cells (GFP−, black). Note that GFAP::GFP+CD133+EGFR+ cells are dimmer than GFAP::GFP + and GFAP::GFP+CD133 + cells. (D) Proportion of each CD133+ purified astrocyte subpopulation that expresses Ki67 and MCM2 (n=3; *p<0.05, **p<0.01, unpaired Students’ t-test, mean±SEM). (E) Proportion of each CD133+ purified astrocyte subpopulation labeled after a single pulse of BrdU (light green) or after 14 days of BrdU in the drinking water (dark green) (n=3 and n=4, respectively, **p<0.01, unpaired Students’ t-test, mean±SEM). (F) Label-retaining cell (LRC) fraction in the CD133+ purified astrocyte populations 14 or 30 days after 14 days of BrdU administration (n=4, mean±SEM). (G) Representative FACS plots of CD133+ astrocyte subpopulations from saline and Ara-C treated mice. (H) Summary of markers expressed by CD133+ purified astrocytes. See also Figure S4 and S6.
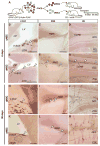
Figure 4. qNSCs and aNSCs are neurogenic in vivo
(A) Schema of experimental design. (B–G) Horizontal brain sections showing PLAP+ cells (purple, arrowheads) 1 week after transplantation of qNSCs (B–D) and aNSCs (E–G). At this time point, aNSCs generated numerous migrating neuroblasts, whereas no cells were detected in the RMS or in the olfactory bulb of brains transplanted with qNSCs. (H–M) Horizontal brain sections showing PLAP+ cells (purple, arrowheads) 1 month after transplantation of qNSCs (H–J) and aNSCs (K–M). In transplants from both populations, cells were present in the V-SVZ and RMS and had generated mature olfactory bulb interneurons. Scale bars: 200 μm. STR: Striatum; CP: Choroid Plexus; LV: Lateral Ventricle; RMS: Rostral Migratory Stream; GCL: Granular Cell Layer; PGL: Periglomerular Layer.
Figure 5. Purified qNSCs and aNSCs give rise to neurospheres with different proliferative properties and kinetics
(A) Single cell colony formation efficiency of FACS-purified qNSCs and aNSCs in adherent cultures (n=3, mean±SEM). (B) Representative phase contrast image of an adherent colony from a single qNSC after 12 days in the presence of EGF. Scale bar: 100μm. (C) Confocal image of neurons (βIII Tubulin, red), astrocytes (GFAP, green) and oligodendrocytes (O4, blue) derived from qNSCs plated under adherent conditions. Scale bar: 10μm (D) Quantification of cell proliferation when plated at 1.4 cells/ul with EGF under non-adherent conditions after 6 or 12 days (n=5, **p<0.01 compared to qNSCs at the same time point, unpaired Students’ t-test, mean±SEM). (E–H) Representative FACS plots of purified CD133+ astrocytes immediately resorted after isolation from the brain (E–F) and of primary neurospheres derived from each population after 12 days for qNSCs and 6 days for aNSCs cultured in EGF (G–H). (I–J) Clonal activation efficiency of purified GFAP::GFP+, GFAP::GFP+CD133+ and GFAP::GFP+CD133+EGFR+ cells, isolated from primary neurospheres of each population (in EGF, n=3, *p<0.05, **p<0.01, unpaired Students’ t-test, mean±SEM). (K) Neurosphere formation 12 hours after Ara-C treatment as compared to saline treated controls (n=6, mean±SEM). See also Figure S5 and S6.
Figure 6. qNSCs are Nestin negative
(A) Proportion of acutely-plated purified qNSCs and aNSCs immunostained for MCM2 and Nestin (n=3, mean±SEM). (B) Images of FACS-purified qNSCs cultured in EGF, fixed at different time points and immunostained with EGFR, MCM2 and Nestin. Three types of cells are present: rounded cells with a condensed nucleus that do not express EGFR, MCM2 or Nestin (Type 1); rounded cells with a larger nucleus that express EGFR, MCM2 and Nestin (Type 2); EGFR+MCM2+Nestin+ cells with elongated processes (Type 3). Type 3 cells resemble aNSCs after 3 days in culture. Scale bars: 10 μm. (C) Quantification of activated qNSCs in culture after 2 hrs, 1, 3, 5 or 7 days after plating (n=4, mean±SEM). (D–E) Confocal images showing mP2-mCherry+ cells (red) in whole mount labeled with EGF-A647 (green) and immunostained for Nestin (blue). In D, two cells contact the ventricle between ependymal cells, do not bind EGF-A647 (DI, arrows) and are Nestin negative in the subventricular projection (DII). In E, an EGF-A647-labeled cell (EI, arrow) is co-immunostained with Nestin in the subventricular projection (EII, arrowheads in inset). Interestingly, not all processes contained Nestin. Scale bars: 30 μm. See also Figure S7.
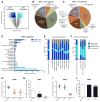
Figure 7. Gene expression analysis of qNSCs and aNSCs reveals distinct molecular signatures
(A) Volcano plot of differentially expressed probesets in qNSCs and aNSCs. Probes have at least 2-fold change in expression and a corrected p-value < 0.05. See also Table S1. (B–C) Pie charts showing representative GO categories for differentially expressed probesets in qNSC and aNSC (as determined in A). See also Table S2. (D) Gene Set Enrichment Analysis (GSEA) for qNSCs vs aNSCs. Sets have FDR < 0.05 and are hand-curated into thematic categories. See also Table S3. (E–F) Percentage of overlap with signatures of quiescent and dividing stem cells from other organs: long term (LT)/quiescent signatures (G) and short term (ST)/proliferative signatures (H) as determined by fold-change analysis of published lists compared to qNSC and aNSC populations. Qui: Quiescent, HSC: Hematopoietic Stem Cells, qMuSC: Quiescent Muscle Stem Cells, qBulgeSC: Quiescent Bulge Stem Cells, qISC: Quiescent Intestinal Stem Cells. See also Table S6. (G–J) Targeted GPCR ligand screen. See also Table S7. (G) Quantification of qNSC activation (fold change in % Nestin+ clones) as compared to controls (empty dots). For complete screening panel, see Figure S8L. (H) Quantification of percentage of MCM2+ cells within activated Nestin+ clones. (I) Quantification of aNSC clones (fold change of % clones that underwent division) as compared to controls (empty dots). (J) Quantification of total MCM2+ aNSCs. n=3, *p<0.05, ***p<0.001. See also Figure S8 and Tables S4, S5 and S8.
Figure 8. In vivo and in vitro properties of V-SVZ stem cells and their progeny
Quiescent stem cells (GFAP+CD133+) are Nestin negative, label-retaining (blue line) and neurogenic in vivo (magenta line), but only very rarely give rise to neurospheres and adherent colonies in vitro (light blue line). Activated stem cells (GFAP+CD133+EGFR+) are highly proliferative (green line) and rapidly generate neurons in vivo, and are enriched in neurosphere/colony formation. Previous work has shown that EGFR+ transit amplifying cells are also highly proliferative in vivo and give rise to neurospheres. Of note, quiescent stem cells were also present among CD133− astrocytes. Niche astrocytes have a branched morphology.
Comment in
- The quintessence of quiescence.
Yabut O, Pleasure SJ. Yabut O, et al. Neuron. 2014 May 7;82(3):501-3. doi: 10.1016/j.neuron.2014.04.025. Neuron. 2014. PMID: 24811373
Similar articles
- Area-Specific Regulation of Quiescent Neural Stem Cells by Notch3 in the Adult Mouse Subependymal Zone.
Kawai H, Kawaguchi D, Kuebrich BD, Kitamoto T, Yamaguchi M, Gotoh Y, Furutachi S. Kawai H, et al. J Neurosci. 2017 Dec 6;37(49):11867-11880. doi: 10.1523/JNEUROSCI.0001-17.2017. Epub 2017 Nov 3. J Neurosci. 2017. PMID: 29101245 Free PMC article. - A mosaic world: puzzles revealed by adult neural stem cell heterogeneity.
Chaker Z, Codega P, Doetsch F. Chaker Z, et al. Wiley Interdiscip Rev Dev Biol. 2016 Nov;5(6):640-658. doi: 10.1002/wdev.248. Epub 2016 Sep 20. Wiley Interdiscip Rev Dev Biol. 2016. PMID: 27647730 Free PMC article. Review. - Regional and stage-specific effects of prospectively purified vascular cells on the adult V-SVZ neural stem cell lineage.
Crouch EE, Liu C, Silva-Vargas V, Doetsch F. Crouch EE, et al. J Neurosci. 2015 Mar 18;35(11):4528-39. doi: 10.1523/JNEUROSCI.1188-14.2015. J Neurosci. 2015. PMID: 25788671 Free PMC article. - Neurogenic subventricular zone stem/progenitor cells are Notch1-dependent in their active but not quiescent state.
Basak O, Giachino C, Fiorini E, Macdonald HR, Taylor V. Basak O, et al. J Neurosci. 2012 Apr 18;32(16):5654-66. doi: 10.1523/JNEUROSCI.0455-12.2012. J Neurosci. 2012. PMID: 22514327 Free PMC article. - Concise review: Quiescent and active states of endogenous adult neural stem cells: identification and characterization.
Wang YZ, Plane JM, Jiang P, Zhou CJ, Deng W. Wang YZ, et al. Stem Cells. 2011 Jun;29(6):907-12. doi: 10.1002/stem.644. Stem Cells. 2011. PMID: 21557389 Free PMC article. Review.
Cited by
- Switching of RNA splicing regulators in immature neuroblasts during adult neurogenesis.
Bernou C, Mouthon MA, Daynac M, Kortulewski T, Demaille B, Barroca V, Couillard-Despres S, Dechamps N, Ménard V, Bellenger L, Antoniewski C, Chicheportiche AD, Boussin FD. Bernou C, et al. Elife. 2024 Nov 22;12:RP87083. doi: 10.7554/eLife.87083. Elife. 2024. PMID: 39576691 Free PMC article. - Pharmacological targeting of smoothened receptor cysteine-rich domain by Budesonide promotes in vitro myelination.
Recchia AD, Dominicis A, D'Amore VM, Fabiano T, Al Jaf AIA, Peria S, Basoli F, Rainer A, Marinelli L, Di Leva FS, Ragnini-Wilson A. Recchia AD, et al. Front Mol Neurosci. 2024 Oct 15;17:1473960. doi: 10.3389/fnmol.2024.1473960. eCollection 2024. Front Mol Neurosci. 2024. PMID: 39473481 Free PMC article. - Interaction between subventricular zone microglia and neural stem cells impacts the neurogenic response in a mouse model of cortical ischemic stroke.
Nath S, Martínez Santamaría JC, Chu YH, Choi JS, Conforti P, Lin JD, Sankowski R, Amann L, Galanis C, Wu K, Deshpande SS, Vlachos A, Prinz M, Lee JK, Schachtrup C. Nath S, et al. Nat Commun. 2024 Oct 24;15(1):9095. doi: 10.1038/s41467-024-53217-1. Nat Commun. 2024. PMID: 39448558 Free PMC article. - Dynamic spatiotemporal activation of a pervasive neurogenic competence in striatal astrocytes supports continuous neurogenesis following injury.
Fogli M, Nato G, Greulich P, Pinto J, Ribodino M, Valsania G, Peretto P, Buffo A, Luzzati F. Fogli M, et al. Stem Cell Reports. 2024 Oct 8;19(10):1432-1450. doi: 10.1016/j.stemcr.2024.08.006. Epub 2024 Sep 19. Stem Cell Reports. 2024. PMID: 39303706 Free PMC article. - Dynamics of Neurogenic Signals as Biological Switchers of Brain Plasticity.
Moreira JF, Solá S. Moreira JF, et al. Stem Cell Rev Rep. 2024 Nov;20(8):2032-2044. doi: 10.1007/s12015-024-10788-2. Epub 2024 Sep 11. Stem Cell Rev Rep. 2024. PMID: 39259446 Free PMC article. Review.
References
- Ahn S, Joyner AL. In vivo analysis of quiescent adult neural stem cells responding to Sonic hedgehog. Nature. 2005;437:894–897. - PubMed
- Alfonso J, Le Magueresse C, Zuccotti A, Khodosevich K, Monyer H. Diazepam binding inhibitor promotes progenitor proliferation in the postnatal SVZ by reducing GABA signaling. Cell Stem Cell. 2012;10:76–87. - PubMed
- Barnabé-Heider F, Meletis K, Eriksson M, Bergmann O, Sabelström H, Harvey MA, Mikkers H, Frisén J. Genetic manipulation of adult mouse neurogenic niches by in vivo electroporation. Nat Methods. 2008;5:189–96. - PubMed
- Beckervordersandforth R, Tripathi P, Ninkovic J, Bayam E, Lepier A, Stempfhuber B, Kirchhoff F, Hirrlinger J, Haslinger A, Lie DC, et al. In vivo fate mapping and expression analysis reveals molecular hallmarks of prospectively isolated adult neural stem cells. Cell Stem Cell. 2010;7:744–758. - PubMed
Publication types
MeSH terms
Substances
Grants and funding
- T32 MH 15174-29/MH/NIMH NIH HHS/United States
- NS053884/NS/NINDS NIH HHS/United States
- NS074039/NS/NINDS NIH HHS/United States
- T32 GM007088/GM/NIGMS NIH HHS/United States
- TL1 TR000082/TR/NCATS NIH HHS/United States
- R01 NS053884/NS/NINDS NIH HHS/United States
- F31 NS081990/NS/NINDS NIH HHS/United States
- F31 NS079057/NS/NINDS NIH HHS/United States
- NS053884-03S109/NS/NINDS NIH HHS/United States
- T32 GM008224/GM/NIGMS NIH HHS/United States
- T32 MH015174/MH/NIMH NIH HHS/United States
- 1F31NS081990/NS/NINDS NIH HHS/United States
- R01 NS074039/NS/NINDS NIH HHS/United States
- 1F31NS079057/NS/NINDS NIH HHS/United States
LinkOut - more resources
Full Text Sources
Other Literature Sources
Research Materials
Miscellaneous
