The late endosomal p14-MP1 (LAMTOR2/3) complex regulates focal adhesion dynamics during cell migration - PubMed (original) (raw)
. 2014 May 26;205(4):525-40.
doi: 10.1083/jcb.201310043. Epub 2014 May 19.
Julia M Scheffler 2, Mariana E G de Araujo 2, Taras Stasyk 2, Teodor Yordanov 2, Hannes L Ebner 1, Martin Offterdinger 2, Sebastian Munck 3, Michael W Hess 2, Sara A Wickström [ 4](#full-view-affiliation-4 "Paul Gerson Unna group "Skin Homeostasis and Ageing", Max Planck Institute for Biology of Ageing, 50931 Cologne, Germany Department of Molecular Medicine, Max Planck Institute of Biochemistry, 82152 Martinsried, Germany."), Anika Lange 5, Winfried Wunderlich 6, Reinhard Fässler 5, David Teis 2, Lukas A Huber 7
Affiliations
- PMID: 24841562
- PMCID: PMC4033770
- DOI: 10.1083/jcb.201310043
The late endosomal p14-MP1 (LAMTOR2/3) complex regulates focal adhesion dynamics during cell migration
Natalia Schiefermeier et al. J Cell Biol. 2014.
Abstract
Cell migration is mediated by the dynamic remodeling of focal adhesions (FAs). Recently, an important role of endosomal signaling in regulation of cell migration was recognized. Here, we show an essential function for late endosomes carrying the p14-MP1 (LAMTOR2/3) complex in FA dynamics. p14-MP1-positive endosomes move to the cell periphery along microtubules (MTs) in a kinesin1- and Arl8b-dependent manner. There they specifically target FAs to regulate FA turnover, which is required for cell migration. Using genetically modified fibroblasts from p14-deficient mice and Arl8b-depleted cells, we demonstrate that MT plus end-directed traffic of p14-MP1-positive endosomes triggered IQGAP1 disassociation from FAs. The release of IQGAP was required for FA dynamics. Taken together, our results suggest that late endosomes contribute to the regulation of cell migration by transporting the p14-MP1 scaffold complex to the vicinity of FAs.
© 2014 Schiefermeier et al.
Figures
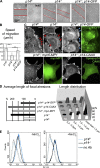
Figure 1.
Loss of p14–MP1 endosomal signaling impairs cell migration and FA. (A) Migration of MEFs in wound-healing assay. Red lines depict edges of the wound. See also
Video 1
. (B) Calculation of migration speed of MEFs in wound-healing assay (µm/h, mean of cell migration speeds ± SD; **, P < 0.001, Student’s t test). (C) IF: anti-Paxillin antibody. Note formation of elongated peripheral FAs in p14−/− MEFs (red arrows) compared with FAs and FCs at the leading edge of the control p14f/− MEFs (red arrowheads). Expression of myc6-MP1 or Xpress-p14-CAAX does not restore FA pattern in p14−/− MEFs (presence of myc6-MP1 is confirmed by anti-myc antibody showing cytoplasmic distribution of MP1, presence of p14-CAAX is confirmed by anti-Xpress antibody). Reduction of FA size can be achieved by expression of p14-GFP (blue arrowheads, presence and localization of p14-GFP is confirmed by GFP image). Bar, 10 µm. (D) Quantification of average FA length and detailed analyzes of FA populations (“Length distribution”) in MEFs. Left graph: mean in percent ± SEM compared with control p14f/− MEFs (mean of FA length in control p14f/− MEFs was taken as 100%). Right graph: FAs are clustered in four specified length groups (x-axis) and are presented in percentage of all adhesions (y-axis) in each type of MEFs. See also
Table S1
. (E) FACS analysis of activated β1 integrins (identified with 9EG7 antibody) reveals no difference in expression in p14f/− MEFs (black line) and p14−/− MEFs (blue line; dotted lines indicate negative controls). The data shown are from a single representative experiment out of three independent experiments. For complete integrin profile, see
Fig. S2
.
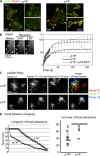
Figure 2.
Analysis of FA turnover. (A) IF of p14f/− and p14−/− MEFs with anti-Paxillin and anti-Zyxin antibodies. White arrows indicate leading edge formation areas in the control cells where no Zyxin-positive FAs are detected (magnification). In the p14 knockout MEFs the overall elongated FAs are also positive for Zyxin (magnification). (B) FRAP analysis of FAs in indicated MEFs. Image shows representative example of FAs (white arrows) before bleaching and during recovery time in p14f/− MEFs. Graph shows curves of fluorescence recovery (mean of 10 cells per group, number of measured FAs = 60) after bleaching of indicated MEFs. (C) TIRF microscopy of MEFs expressing mRuby-Paxillin. See also
Videos 2
and
3
. Shown are mature FAs of magnified areas of control and p14 knockout MEFs at three different timeframes (1 frame = 10 min). Merging of the three color-coded frames indicates the development of single FAs over time. Note: white FAs are stable over the shown time period (20 min). (D) Quantification of FA turnover. The left graph displays the existence of single FAs (n = 168) as dots over a time period of 60 min. All existing FAs were included. The right graph shows dynamic FA events. New growing FAs were analyzed during a time period of 80 min (P < 0.001).
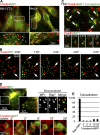
Figure 3.
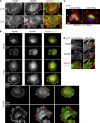
p14–MP1-carrying late endosomes target FAs. (A) IF of p14–MP1-carrying endosomes colocalizing with FAs in cells coexpressing GFP-MP1 (green) and mCherry-Paxillin (red; see white arrowheads). (B) NIH3T3 cell coexpressing GFP-MP1 (green) and mCherry-Paxillin (red). White arrows: FAs repetitively targeted by p14–MP1-carrying endosomes. See
Video 4
. (C) TIRF microscopy. Overlay of MP1-GFP Z-projection (green) and FAs (mCherry-Paxillin is shown in red). White arrowheads on selected time-lapse images point to individual MP1 endosomes (green) that target FAs (red). See
Video 5
. (D) Colocalization of MP1 with Rab7 and Transferrin. Top: images from time-lapse series of HeLa cell coexpressing GFP-MP1 (green) and mCherry-Rab7 (red). GFP-MP1 colocalizes with mCherry-Rab7 in cell center and cell periphery. Deconvolved image from the time-lapse shows colocalization of MP1 (green) and Rab7 (red) on ring-like structures of endosomes. Bottom: uptake of Transferrin (red) in HeLa cell expressing GFP-MP1 (green). (E) Quantification of the colocalization (mean ± SEM) between Rab7 and MP1 versus Transferrin and MP1. Insets in A and D are taken from white boxes in main panels.
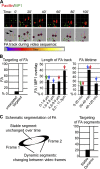
Figure 4.
MP1 endosomes target mature FAs, but neither FCs nor newly formed FAs. (A) HeLa cells expressing GFP-MP1 (green) and mCherry-Paxillin (red) are used for detailed quantification of FA targeting. Top: images from the video sequence showing overlay of FAs (red) and endosomal (green) masks. Bottom: center of each FA was identified as a round sphere (purple) and used for further FA tracking. FA tracks (black arrows) during time lapse are illustrated in a line of different colors, indicating temporal changes of FA positions (as shown on the color bar below). (B) Quantification of the FA targeting by p14–MP1-carrying endosomes (mean in percentage ± SEM) and of FA targeting (per frame) during the time lapse. Green arrows indicate parameter combination of highly dynamic FAs, blue arrows of mature stable FAs, and red arrows of sliding FAs. Experiments were repeated three times, n = 10 (n = the number of cells used for quantification). (C) Schematic segmentation of FAs dissected with respect to the change of its fluorescence signal over time (left image). Right graph depictures mean calculation of fluorescence MP1–Paxillin colocalization in the FA segments. Experiments were repeated three times, n = 10 (n = the number of cells used for quantification).
Figure 5.
Arl8b-dependent MT plus end–directed transport of late endosomes regulates FAs. (A) MP1 endosomes are transported along MTs. Time-lapse images of HeLa cells expressing GFP-MP1 (green), mCherry-Paxillin (red), and mCherry-tubulin (red) show colocalization of MP1 and MTs (white arrowheads). Representative individual endosome moves along MTs toward two FAs (bottom panels, white arrowheads). See also
Video 7
and
8
. (B) Nocodazole treatment of a cell transfected as in A results in MT depolymerization and “trapping” of few GFP-MP1 endosomes in FAs (white arrows and arrowheads). Time-lapse images of the same cell show that positions of GFP-MP1 endosomes do not change in time due to abolished MP1 transport. (C) Arl8b knockdown in MEFs. IF: anti-LAMP1 (green), anti-tubulin (red) antibodies, and Hoechst. LAMP1-positive late endosomes collapse to the perinuclear region upon Arl8b knockdown (white arrow). WB: anti-Arl8b antibody, anti-tubulin used as loading control. (D) The p14−/−;p14-GFP MEFs treated with control and Arl8b RNAi. The late p14-GFP endosomes cluster in the Arl8b RNAi-treated cells (red arrow). See also
Video 9
. (E) The graph on the left shows the quantification of average FA length in MEFs. Mean in percent ± SEM compared with control p14f/− MEFs treated with control RNAi (mean of FA length in control p14f/− MEFs treated with control RNAi was taken as 100%). See also
Table S1
. The graph on the right shows the migration speed of p14−/−;p14-GFP MEFs transfected with control (n = 26) and Arl8b siRNA (n = 66) in wound-healing assay (µm/h, mean of cell migration speeds ± SD). (F) Colocalization of Paxillin and Rab7 in MEFs. Images from time-lapse series of MEF cells coexpressing GFP-Rab7 (green) and mCherry-Paxillin (red). White arrows indicate FAs targeted by GFP-Rab7. See also
Video 10
.
Figure 6.
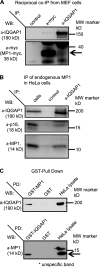
IQGAP1 and MP1 interaction. (A) Reciprocal co-immunoprecipitation of myc6-MP1 and IQGAP1. Cell extracts were prepared from myc6-MP1–expressing p14f/− MEFs. IP: with anti-myc (lane 2) and anti-IQGAP1 (lane 3) polyclonal antibodies; IgG control (lane 1). WB: anti-IQGAP1 (top) and anti-myc (bottom) antibodies, respectively. Black arrow indicates myc6-MP1 signal. (B) Immunoprecipitation of endogenous MP1 and p18. Cell extracts were prepared from HeLa cells. IP: with anti-IQGAP1 (lane 3) polyclonal antibody; cell lysates (lane 1), IgG control (lane 2). WB: anti-IQGAP1 (top), anti-p18 (middle), and anti-MP1 (bottom) antibodies, respectively. (C) Top: HeLa protein lysates were incubated with GST-MP1 or GST alone immobilized on glutathione-Sepharose beads. WB: anti-IQGAP1 antibody. Lysates not subjected to GST pull-down were processed in parallel (HeLa lysate). Bottom: HeLa protein lysates were incubated with GST-IQGAP1 or GST alone immobilized on glutathione-Sepharose beads. WB: anti-MP1 antibody. Lysates not subjected to GST pull-down were processed in parallel (HeLa lysate). Black arrow indicates MP1 signal.
Figure 7.
Absence of p14–MP1 or blockage of Arl8b-dependent late endosomal transport causes IQGAP1 accumulation in FAs. (A) IF: anti-Paxillin and anti-IQGAP1 antibodies. IQGAP1 localizes to the leading edge in p14f/− (white arrows) and colocalizes with Paxillin in FAs in p14−/− MEFs (red arrows). (B) IF: anti-Paxillin and anti-IQGAP1 antibodies. Shown are different time points during spreading of p14f/− and p14−/− MEFs. White arrows indicate accumulation of IQGAP1 at the leading edge in control MEFs. Red arrows point at IQGAP1 localization at Paxillin-positive FAs in control and p14−/− MEFs. (C) IF: anti-LAMP1 (green), anti-IQGAP1 (red) antibodies, and Hoechst (blue). IQGAP1 localizes to the leading edge in p14f/− MEFs treated with control RNAi (white arrows) and localizes to FAs upon Arl8b depletion (red arrows). (D) p14f/− MEFs treated as in C. IF: anti-Paxillin and anti-IQGAP1 antibodies. Note IQGAP1 localization to the leading edge in p14f/− MEFs treated with control RNAi (white arrows) versus colocalization of IQGAP1 and Paxillin in FAs upon ARl8b depletion (red arrows).
Figure 8.
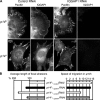
In the absence of p14–MP1 endosomal signaling, down-regulation of IQGAP1 by RNAi rescues FAs and cell migration. (A) IF: anti-Paxillin and anti-IQGAP1 antibodies. (B) Left: quantification of average FA length in MEFs transfected with control or IQGAP1 RNAi. Mean in percent ± SEM is compared with control p14f/− MEFs transfected with control RNAi (taken as 100%). Right: calculation of speed of migration in wound-healing assays. Mean in µm/h ± SEM. Importantly, only cells that had strong down-regulation of IQGAP1 (no signal on IF using anti-IQGAP1 antibodies as in A) were used for the calculation. See also
Table S1
.
Similar articles
- p14-MP1-MEK1 signaling regulates endosomal traffic and cellular proliferation during tissue homeostasis.
Teis D, Taub N, Kurzbauer R, Hilber D, de Araujo ME, Erlacher M, Offterdinger M, Villunger A, Geley S, Bohn G, Klein C, Hess MW, Huber LA. Teis D, et al. J Cell Biol. 2006 Dec 18;175(6):861-8. doi: 10.1083/jcb.200607025. J Cell Biol. 2006. PMID: 17178906 Free PMC article. - Stability of the endosomal scaffold protein LAMTOR3 depends on heterodimer assembly and proteasomal degradation.
de Araújo ME, Stasyk T, Taub N, Ebner HL, Fürst B, Filipek P, Weys SR, Hess MW, Lindner H, Kremser L, Huber LA. de Araújo ME, et al. J Biol Chem. 2013 Jun 21;288(25):18228-42. doi: 10.1074/jbc.M112.349480. Epub 2013 May 7. J Biol Chem. 2013. PMID: 23653355 Free PMC article. - Crystal structure of the p14/MP1 scaffolding complex: how a twin couple attaches mitogen-activated protein kinase signaling to late endosomes.
Kurzbauer R, Teis D, de Araujo ME, Maurer-Stroh S, Eisenhaber F, Bourenkov GP, Bartunik HD, Hekman M, Rapp UR, Huber LA, Clausen T. Kurzbauer R, et al. Proc Natl Acad Sci U S A. 2004 Jul 27;101(30):10984-9. doi: 10.1073/pnas.0403435101. Epub 2004 Jul 19. Proc Natl Acad Sci U S A. 2004. PMID: 15263099 Free PMC article. - Endosomal signaling and cell migration.
Schiefermeier N, Teis D, Huber LA. Schiefermeier N, et al. Curr Opin Cell Biol. 2011 Oct;23(5):615-20. doi: 10.1016/j.ceb.2011.04.001. Epub 2011 May 3. Curr Opin Cell Biol. 2011. PMID: 21546233 Free PMC article. Review. - Targeting and transport: how microtubules control focal adhesion dynamics.
Stehbens S, Wittmann T. Stehbens S, et al. J Cell Biol. 2012 Aug 20;198(4):481-9. doi: 10.1083/jcb.201206050. J Cell Biol. 2012. PMID: 22908306 Free PMC article. Review.
Cited by
- Bidirectional lysosome transport: a balancing act between ARL8 effectors.
Kendrick AA, Christensen JR. Kendrick AA, et al. Nat Commun. 2022 Sep 7;13(1):5261. doi: 10.1038/s41467-022-32965-y. Nat Commun. 2022. PMID: 36071047 Free PMC article. - Transcription factor EB regulates phosphatidylinositol-3-phosphate levels that control lysosome positioning in the bladder cancer model.
Mathur P, De Barros Santos C, Lachuer H, Patat J, Latgé B, Radvanyi F, Goud B, Schauer K. Mathur P, et al. Commun Biol. 2023 Jan 28;6(1):114. doi: 10.1038/s42003-023-04501-1. Commun Biol. 2023. PMID: 36709383 Free PMC article. - Inhibition of lysosome-tethered Ragulator-Rag-3D complex restricts the replication of Enterovirus 71 and Coxsackie A16.
Wang X, Hu Z, Zhang W, Wu S, Hao Y, Xiao X, Li J, Yu X, Yang C, Wang J, Zhang H, Ma F, Shi W, Wang J, Lei X, Zhang X, He S. Wang X, et al. J Cell Biol. 2023 Dec 4;222(12):e202303108. doi: 10.1083/jcb.202303108. Epub 2023 Oct 31. J Cell Biol. 2023. PMID: 37906052 Free PMC article. - mTOR controls lysosome tubulation and antigen presentation in macrophages and dendritic cells.
Saric A, Hipolito VE, Kay JG, Canton J, Antonescu CN, Botelho RJ. Saric A, et al. Mol Biol Cell. 2016 Jan 15;27(2):321-33. doi: 10.1091/mbc.E15-05-0272. Epub 2015 Nov 18. Mol Biol Cell. 2016. PMID: 26582390 Free PMC article. - Liprin-α1 and ERC1 control cell edge dynamics by promoting focal adhesion turnover.
Astro V, Tonoli D, Chiaretti S, Badanai S, Sala K, Zerial M, de Curtis I. Astro V, et al. Sci Rep. 2016 Sep 23;6:33653. doi: 10.1038/srep33653. Sci Rep. 2016. PMID: 27659488 Free PMC article.
References
Publication types
MeSH terms
Substances
LinkOut - more resources
Full Text Sources
Other Literature Sources
Molecular Biology Databases
Research Materials
Miscellaneous
