Genome-wide analysis of cold adaptation in indigenous Siberian populations - PubMed (original) (raw)
. 2014 May 21;9(5):e98076.
doi: 10.1371/journal.pone.0098076. eCollection 2014.
Luca Pagani 2, Tiago Antao 3, Daniel J Lawson 4, Christina A Eichstaedt 1, Bryndis Yngvadottir 1, Ma Than Than Shwe 5, Joseph Wee 5, Irene Gallego Romero 6, Srilakshmi Raj 7, Mait Metspalu 8, Richard Villems 8, Eske Willerslev 9, Chris Tyler-Smith 10, Boris A Malyarchuk 11, Miroslava V Derenko 11, Toomas Kivisild 12
Affiliations
- PMID: 24847810
- PMCID: PMC4029955
- DOI: 10.1371/journal.pone.0098076
Genome-wide analysis of cold adaptation in indigenous Siberian populations
Alexia Cardona et al. PLoS One. 2014.
Abstract
Following the dispersal out of Africa, where hominins evolved in warm environments for millions of years, our species has colonised different climate zones of the world, including high latitudes and cold environments. The extent to which human habitation in (sub-)Arctic regions has been enabled by cultural buffering, short-term acclimatization and genetic adaptations is not clearly understood. Present day indigenous populations of Siberia show a number of phenotypic features, such as increased basal metabolic rate, low serum lipid levels and increased blood pressure that have been attributed to adaptation to the extreme cold climate. In this study we introduce a dataset of 200 individuals from ten indigenous Siberian populations that were genotyped for 730,525 SNPs across the genome to identify genes and non-coding regions that have undergone unusually rapid allele frequency and long-range haplotype homozygosity change in the recent past. At least three distinct population clusters could be identified among the Siberians, each of which showed a number of unique signals of selection. A region on chromosome 11 (chr11:66-69 Mb) contained the largest amount of clustering of significant signals and also the strongest signals in all the different selection tests performed. We present a list of candidate cold adaption genes that showed significant signals of positive selection with our strongest signals associated with genes involved in energy regulation and metabolism (CPT1A, LRP5, THADA) and vascular smooth muscle contraction (PRKG1). By employing a new method that paints phased chromosome chunks by their ancestry we distinguish local Siberian-specific long-range haplotype signals from those introduced by admixture.
Conflict of interest statement
Competing Interests: The authors have declared that no competing interests exist.
Figures
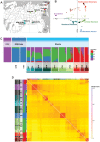
Figure 1. Population structure analyses in Siberian populations.
(A) Averaged sampling locations of the Siberian populations genotyped in this study. (B) Principal component analysis of Siberian populations and reference populations from West Asia (European) and Southeast Asia (Vietnamese). Each dot in the plot represents an individual. The PC axes were rotated 180 degrees anti-clockwise to emphasize the similarity to the geographic map of Eurasia. (C) ADMIXTURE analysis at K = 4. (D) Coancestry heatmap for the Siberian individuals and reference populations (Europe, Vietnamese) output by ChromoPainter/fineSTRUCTURE. The heatmap shows the number of shared genetic chunks between the individuals. The raw data is shown on the bottom left and the aggregated data is shown on the upper right of the heatmap. Adjacent to the heatmap is also the ADMIXTURE plot of the respective individuals. To the left is the maximum a posteriori (MAP) tree generated by fineSTRUCTURE which shows the groupings of the different populations. The following abbreviations are used in the Figure: ALT, Altai-Kizhi; BUR, Buryats; CEU, European; CHB, Han Chinese; CHK, Chukchi; E/SE Asia, East/Southeast Asia; ESK, Eskimo; EVN, Evens; EVK, Evenks; KRK, Koryaks; SHR, Shors; TEL, Teleuts; VTN, Vietnamese; X1, Northeastern Siberian admixed individuals; X2, Southern and Central Siberian admixed individuals; YKT, Yakuts. Reference populations are labelled in italics. Outliers removed in downstream analysis are blacked out in the tree.
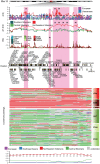
Figure 2. Zooming on the region on chromosome 11 that showed the strongest signals in the Northeastern Siberian populations.
The |iHS|, XP-EHH and PBS scores that showed strong signals (amongst top 10 ranking windows) in the Northeastern Siberian populations are shown in the upper panels for the different Siberian populations. The pink highlights mark the windows present in the top 10 ranking windows in the Northeastern Siberian populations. The rankings are marked on the respective windows in the respective test panels. Protein-coding genes present in the 4 Mb region are shown under the test plots with the genes present in our predefined cold adaptation list marked in bold font (CPT1A and LRP5). The position on the chromosome is given in Mb. The paintings of the phased chromosomes for the region in the Northeastern and Central Siberian individuals are shown underneath the Position legend. The aggregated ancestral probabilities from ChromoPainter for the Northeastern Siberian individuals are displayed below the paintings. The dotted red line shows the threshold for the upper 5% tail (0.75) and the black dotted line shows the mean of the genome-wide probabilities distribution of the Northeastern Siberian ancestor (red).
Figure 3. Genome-wide distribution of significant selection windows.
The distribution of the significant windows of the three different selection tests results (A) XP-EHH, (B) iHS and (C) PBS for the Northeastern Siberian populations. The x-axis show the count of significant windows (Tables S4–S6 in File S2) per 3 Mb region and the y-axis show the amount of 3 Mb regions that had the respective count displayed on the x-axis. In all the different selection tests, the region on chromosome 11:66–69 Mb is the region with the most significant selection windows (highlighted in red).
Similar articles
- Thermal Adaptations in Animals: Genes, Development, and Evolution.
Agata A, Nomura T. Agata A, et al. Adv Exp Med Biol. 2024;1461:253-265. doi: 10.1007/978-981-97-4584-5_18. Adv Exp Med Biol. 2024. PMID: 39289287 Review. - Genomic Evidence of Local Adaptation to Climate and Diet in Indigenous Siberians.
Hallmark B, Karafet TM, Hsieh P, Osipova LP, Watkins JC, Hammer MF. Hallmark B, et al. Mol Biol Evol. 2019 Feb 1;36(2):315-327. doi: 10.1093/molbev/msy211. Mol Biol Evol. 2019. PMID: 30428071 - Genomic adaptation to extreme climate conditions in beef cattle as a consequence of cross-breeding program.
Tian R, Asadollahpour Nanaie H, Wang X, Dalai B, Zhao M, Wang F, Li H, Yang D, Zhang H, Li Y, Wang T, Luan T, Wu J. Tian R, et al. BMC Genomics. 2023 Apr 6;24(1):186. doi: 10.1186/s12864-023-09235-2. BMC Genomics. 2023. PMID: 37024818 Free PMC article. - Adaptive dimensions of health research among indigenous Siberians.
Snodgrass JJ, Sorensen MV, Tarskaia LA, Leonard WR. Snodgrass JJ, et al. Am J Hum Biol. 2007 Mar-Apr;19(2):165-80. doi: 10.1002/ajhb.20624. Am J Hum Biol. 2007. PMID: 17286259 Review. - Genomic landscape of the signals of positive natural selection in populations of Northern Eurasia: A view from Northern Russia.
Khrunin AV, Khvorykh GV, Fedorov AN, Limborska SA. Khrunin AV, et al. PLoS One. 2020 Feb 5;15(2):e0228778. doi: 10.1371/journal.pone.0228778. eCollection 2020. PLoS One. 2020. PMID: 32023328 Free PMC article.
Cited by
- The 1000 Chinese Indigenous Pig Genomes Project provides insights into the genomic architecture of pigs.
Du H, Zhou L, Liu Z, Zhuo Y, Zhang M, Huang Q, Lu S, Xing K, Jiang L, Liu JF. Du H, et al. Nat Commun. 2024 Nov 22;15(1):10137. doi: 10.1038/s41467-024-54471-z. Nat Commun. 2024. PMID: 39578420 Free PMC article. - Thermal Adaptations in Animals: Genes, Development, and Evolution.
Agata A, Nomura T. Agata A, et al. Adv Exp Med Biol. 2024;1461:253-265. doi: 10.1007/978-981-97-4584-5_18. Adv Exp Med Biol. 2024. PMID: 39289287 Review. - Association between thermogenic brown fat and genes under positive natural selection in circumpolar populations.
Ishida Y, Matsushita M, Yoneshiro T, Saito M, Nakayama K. Ishida Y, et al. J Physiol Anthropol. 2024 Aug 19;43(1):19. doi: 10.1186/s40101-024-00368-1. J Physiol Anthropol. 2024. PMID: 39160621 Free PMC article. - THADA inhibits autophagy and increases 5-FU sensitivity in gastric cancer cells via the PI3K/AKT/mTOR signaling pathway.
Lin X, Pan J, Hamoudi H, Yu J. Lin X, et al. Iran J Basic Med Sci. 2024;27(2):195-202. doi: 10.22038/IJBMS.2023.72055.15668. Iran J Basic Med Sci. 2024. PMID: 38234670 Free PMC article. - Whole-genome sequencing provides novel insights into the evolutionary history and genetic adaptation of reindeer populations in northern Eurasia.
Pokharel K, Weldenegodguad M, Dudeck S, Honkatukia M, Lindeberg H, Mazzullo N, Paasivaara A, Peippo J, Soppela P, Stammler F, Kantanen J. Pokharel K, et al. Sci Rep. 2023 Dec 27;13(1):23019. doi: 10.1038/s41598-023-50253-7. Sci Rep. 2023. PMID: 38155192 Free PMC article.
References
- Goebel T (1999) Pleistocene human colonization of Siberia and peopling of the Americas: An ecological approach. Evolutionary Anthropology: Issues, News, and Reviews 8: 208–227.
- Goebel T, Waters MR, O'Rourke DH (2008) The Late Pleistocene Dispersal of Modern Humans in the Americas. Science 319: 1497–1502. - PubMed
- Pitulko VV, Nikolsky PA, Girya EY, Basilyan AE, Tumskoy VE, et al. (2004) The Yana RHS site: humans in the Arctic before the last glacial maximum. Science 303: 52–56. - PubMed
- Clark PU, Dyke AS, Shakun JD, Carlson AE, Clark J, et al. (2009) The Last Glacial Maximum. Science 325: 710–714. - PubMed
Publication types
MeSH terms
LinkOut - more resources
Full Text Sources
Other Literature Sources
Miscellaneous


