Capillary-wall collagen as a biophysical marker of nanotherapeutic permeability into the tumor microenvironment - PubMed (original) (raw)
Capillary-wall collagen as a biophysical marker of nanotherapeutic permeability into the tumor microenvironment
Kenji Yokoi et al. Cancer Res. 2014.
Abstract
The capillary wall is the chief barrier to tissue entry of therapeutic nanoparticles, thereby dictating their efficacy. Collagen fibers are an important component of capillary walls, affecting leakiness in healthy or tumor vasculature. Using a computational model along with in vivo systems, we compared how collagen structure affects the diffusion flux of a 1-nm chemotherapeutic molecule [doxorubicin (DOX)] and an 80-nm chemotherapy-loaded pegylated liposome (DOX-PLD) in tumor vasculature. We found a direct correlation between the collagen content around a tumor vessel to the permeability of that vessel permeability to DOX-PLD, indicating that collagen content may offer a biophysical marker of extravasation potential of liposomal drug formulations. Our results also suggested that while pharmacokinetics determined the delivery of DOX and DOX-PLD to the same tumor phenotype, collagen content determined the extravasation of DOX-PLD to different tumor phenotypes. Transport physics may provide a deeper view into how nanotherapeutics cross biological barriers, possibly helping explain the balance between biological and physical aspects of drug delivery.
©2014 American Association for Cancer Research.
Conflict of interest statement
Disclosure of any potential Conflicts of Interest: M.F. serves on the Board of Directors of NanoMedical Systems, Inc., ArrowHead Research Corporation, and Leonardo Biosystems, and discloses potential financial interest in the companies. All other authors declare no competing financial interests.
Figures
Figure 1
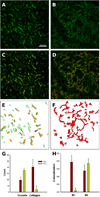
In vivo collagen features in 3LL and 4T1 tumors. 3LL tumors contained thick type IV collagen (green) structures (A), which were missing in 4T1 tumors (B). The visual co-localization of vessels (red) and collagen was stronger in the 3LL tumors (C) than in the 4T1 tumors (D). The image analysis revealed substantially more structural collagen/vessel overlap (yellow) in the 3LL tumors (E) than in the 4T1 tumors (F). Quantitative analysis showed more vessels in the 4T1 tumors than in the 3LL tumors, but the collagen content in the 4T1 tumors was dramatically lower (G). The co-localization of vessels and collagen was expressed in both tumors, but the 3LL tumors have substantially more vessels covered by collagen; M1 and M2 are Mender’s coefficients indicating vessel overlap with collagen (M1) and collagen overlap by vessel (H).
Figure 2
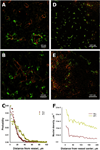
The extravasation differences of the tracer (left) and the PLD (right) in the 3LL and 4T1 tumors within 1 h and 24 hours after the tracer and PLD administration, respectively. The tracer (tagged dextran; green) extravasated from capillaries (red) in the 3LL (A) and 4T1 (B) tumors. The tracer concentration field appeared slightly farther from the vessels in the 4T1 tumors than in 3LL tumors (C). The PLD (red) extravasation from the vessels (green) was negligible in the 3LL tumors (D), but substantial in the 4T1 tumors (E). The 4T1 tumors contained a larger number of nuclei affected by DOX than the 3LL tumors (F).
Figure 3
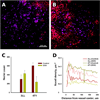
Cell proliferation in the 3LL and 4T1 tumors was a function of DOX extravasation. The 3LL sample (A) shows that proliferating cells (purple) dominate the imaging area, while proliferation is absent where DOX extravasated (red) in the 4T1 tumor (B). The count of proliferating cells in the 3LL and 4T1 tumors (C) and the proliferating cell density around the vessels as a function of distance (D).
Figure 4
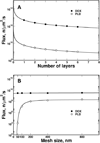
The calculated flux of DOX and PLD particles through the collagen sleeve. The PLD diffusive flux was reduced faster by increasing the collagen thickness with a collagen-mesh size of 400 nm (A), while mesh size had limited impact on DOX (B). The model revealed a small effect of collagen mesh size on DOX flux, while PLD flux was diminished abruptly when the mesh size approached the size of PLD (below 200 nm). Flux is presented on a logarithmic scale.
Figure 5
The effect of DOX loading into PLD on DOX flux through a collagen mesh with the same DOX and PLD particle concentrations.
Figure 6
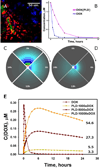
The concentration fields of DOX and PLD around the capillary. (A) DOX concentration (red) around capillaries (green) in a 4T1 tumor; some proliferating nuclei staining in purple with Ki67. By using experimental concentration profiles in plasma (B), the concentration fields for DOX (C) and PLD (D) were calculated, with the vessel being a source surrounded by a 100 µm-thick microenvironment medium. (E) The calculated profiles of average DOX concentration in tissue domain over time; the adjacent numbers show the area under the curve in µM*hours.
Similar articles
- Liposomal doxorubicin extravasation controlled by phenotype-specific transport properties of tumor microenvironment and vascular barrier.
Yokoi K, Chan D, Kojic M, Milosevic M, Engler D, Matsunami R, Tanei T, Saito Y, Ferrari M, Ziemys A. Yokoi K, et al. J Control Release. 2015 Nov 10;217:293-9. doi: 10.1016/j.jconrel.2015.09.044. Epub 2015 Sep 25. J Control Release. 2015. PMID: 26409121 Free PMC article. - Capillary collagen as the physical transport barrier in drug delivery to tumor microenvironment.
Ziemys A, Yokoi K, Kojic M. Ziemys A, et al. Tissue Barriers. 2015 May 6;3(3):e1037418. doi: 10.1080/21688370.2015.1037418. eCollection 2015 Jul-Sep. Tissue Barriers. 2015. PMID: 26451342 Free PMC article. - Serum biomarkers for personalization of nanotherapeutics-based therapy in different tumor and organ microenvironments.
Yokoi K, Tanei T, Godin B, van de Ven AL, Hanibuchi M, Matsunoki A, Alexander J, Ferrari M. Yokoi K, et al. Cancer Lett. 2014 Apr 1;345(1):48-55. doi: 10.1016/j.canlet.2013.11.015. Epub 2013 Dec 24. Cancer Lett. 2014. PMID: 24370567 Free PMC article. - Improved therapeutic activity of folate-targeted liposomal doxorubicin in folate receptor-expressing tumor models.
Gabizon A, Tzemach D, Gorin J, Mak L, Amitay Y, Shmeeda H, Zalipsky S. Gabizon A, et al. Cancer Chemother Pharmacol. 2010 May;66(1):43-52. doi: 10.1007/s00280-009-1132-4. Epub 2009 Sep 25. Cancer Chemother Pharmacol. 2010. PMID: 19779718 - Investigation of Hexadecylphosphocholine (miltefosine) usage in Pegylated liposomal doxorubicin as a synergistic ingredient: In vitro and in vivo evaluation in mice bearing C26 colon carcinoma and B16F0 melanoma.
Teymouri M, Farzaneh H, Badiee A, Golmohammadzadeh S, Sadri K, Jaafari MR. Teymouri M, et al. Eur J Pharm Sci. 2015 Dec 1;80:66-73. doi: 10.1016/j.ejps.2015.08.011. Epub 2015 Aug 20. Eur J Pharm Sci. 2015. PMID: 26299343
Cited by
- Tumor specific liposomes improve detection of pancreatic adenocarcinoma in vivo using optoacoustic tomography.
Yin W, Kimbrough CW, Gomez-Gutierrez JG, Burns CT, Chuong P, Grizzle WE, McNally LR. Yin W, et al. J Nanobiotechnology. 2015 Dec 1;13:90. doi: 10.1186/s12951-015-0139-8. J Nanobiotechnology. 2015. PMID: 26627455 Free PMC article. - An Insight into Perfusion Anisotropy within Solid Murine Lung Cancer Tumors.
Martino A, Terracciano R, Milićević B, Milošević M, Simić V, Fallon BC, Carcamo-Bahena Y, Royal ALR, Carcamo-Bahena AA, Butler EB, Willson RC, Kojić M, Filgueira CS. Martino A, et al. Pharmaceutics. 2024 Jul 30;16(8):1009. doi: 10.3390/pharmaceutics16081009. Pharmaceutics. 2024. PMID: 39204354 Free PMC article. - Co-delivery of paclitaxel and cisplatin in poly(2-oxazoline) polymeric micelles: Implications for drug loading, release, pharmacokinetics and outcome of ovarian and breast cancer treatments.
Wan X, Beaudoin JJ, Vinod N, Min Y, Makita N, Bludau H, Jordan R, Wang A, Sokolsky M, Kabanov AV. Wan X, et al. Biomaterials. 2019 Feb;192:1-14. doi: 10.1016/j.biomaterials.2018.10.032. Epub 2018 Oct 31. Biomaterials. 2019. PMID: 30415101 Free PMC article. - Clinical Cancer Nanomedicine.
Wolfram J, Ferrari M. Wolfram J, et al. Nano Today. 2019 Apr;25:85-98. doi: 10.1016/j.nantod.2019.02.005. Epub 2019 Mar 6. Nano Today. 2019. PMID: 31360214 Free PMC article. - Progression-dependent transport heterogeneity of breast cancer liver metastases as a factor in therapeutic resistance.
Ziemys A, Yokoi K, Kai M, Liu YT, Kojic M, Simic V, Milosevic M, Holder A, Ferrari M. Ziemys A, et al. J Control Release. 2018 Dec 10;291:99-105. doi: 10.1016/j.jconrel.2018.10.014. Epub 2018 Oct 14. J Control Release. 2018. PMID: 30332610 Free PMC article.
References
- Koo OM, Rubinstein I, Onyuksel H. Role of nanotechnology in targeted drug delivery and imaging: A concise review. Nanomedicine: Nanotechnology, Biology and Medicine. 2005;1:193–212. - PubMed
- Ferrari M. Cancer nanotechnology: Opportunities and challenges. Nat Rev Cancer. 2005;5:161–171. - PubMed
- Peer D, Karp JM, Hong S, Farokhzad OC, Margalit R, Langer R. Nanocarriers as an emerging platform for cancer therapy. Nat Nanotechnol. 2007;2:751–760. - PubMed
- Maeda H, Wu J, Sawa T, Matsumura Y, Hori K. Tumor vascular permeability and the epr effect in macromolecular therapeutics: A review. J Control Release. 2000;65:271–284. - PubMed
- Matsumura Y, Maeda H. A new concept for macromolecular therapeutics in cancer chemotherapy: Mechanism of tumoritropic accumulation of proteins and the antitumor agent smancs. Cancer Res. 1986;46:6387–6392. - PubMed
Publication types
MeSH terms
Substances
LinkOut - more resources
Full Text Sources
Other Literature Sources
