FIH-1-Mint3 axis does not control HIF-1 transcriptional activity in nucleus pulposus cells - PubMed (original) (raw)
FIH-1-Mint3 axis does not control HIF-1 transcriptional activity in nucleus pulposus cells
Yuichiro Hirose et al. J Biol Chem. 2014.
Abstract
The objective of this study was to determine the role of FIH-1 in regulating HIF-1 activity in the nucleus pulposus (NP) cells and the control of this regulation by binding and sequestration of FIH-1 by Mint3. FIH-1 and Mint3 were both expressed in the NP and were shown to strongly co-localize within the cell nucleus. Although both mRNA and protein expression of FIH-1 decreased in hypoxia, only Mint3 protein levels were hypoxiasensitive. Overexpression of FIH-1 was able to reduce HIF-1 function, as seen by changes in activities of hypoxia response element-luciferase reporter and HIF-1-C-TAD and HIF-2-TAD. Moreover, co-transfection of either full-length Mint3 or the N terminus of Mint3 abrogated FIH-1-dependent reduction in HIF-1 activity under both normoxia and hypoxia. Nuclear levels of FIH-1 and Mint3 decreased in hypoxia, and the use of specific nuclear import and export inhibitors clearly showed that cellular compartmentalization of overexpressed FIH-1 was critical for its regulation of HIF-1 activity in NP cells. Interestingly, microarray results after stable silencing of FIH-1 showed no significant changes in transcripts of classical HIF-1 target genes. However, expression of several other transcripts, including those of the Notch pathway, changed in FIH-1-silenced cells. Moreover, co-transfection of Notch-ICD could restore suppression of HIF-1-TAD activity by exogenous FIH-1. Taken together, these results suggest that, possibly due to low endogenous levels and/or preferential association with substrates such as Notch, FIH-1 activity does not represent a major mechanism by which NP cells control HIF-1-dependent transcription, a testament to their adaptation to a unique hypoxic niche.
Figures
FIGURE 1.
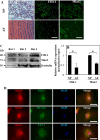
FIH-1 and Mint3 are expressed in rat NP tissues. A, immunohistochemistry of FIH-1 and Mint3 in rat intervertebral disc tissues. Sagittal sections of the intervertebral disc of a mature rat were treated with either FIH-1 or Mint3 antibodies. FIH-1 and Mint3 proteins were expressed in both NP and AF tissues. Scale bar, 100 μm. B, real-time RT-PCR analysis of FIH-1 and Mint3 in rat NP and AF tissues shows lower expression of both FIH-1 and Mint3 in AF tissues compared with NP. Data represent the mean ± S.E. (error bars) from three rats (p < 0.1). C, Western blot analysis of FIH-1 and Mint3 expression in NP tissues from three rats. All tissue samples expressed both the proteins. D, subcellular co-localization of FIH-1 and Mint3 in NP cells. Immunofluorescence shows that FIH-1 and Mint3 are primarily co-localized in the cell nucleus (top) and to a smaller extent in the Golgi (middle) but not in early endosomes (bottom). Scale bars, 50 μm.
FIGURE 2.
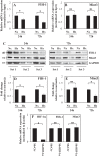
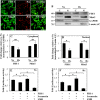
FIH-1 and Mint3 levels are decreased in hypoxia in NP cells. A and B, real-time RT-PCR analysis of hypoxic changes in FIH-1 and Mint3 mRNA expression in NP cells. FIH-1 mRNA expression was significantly down-regulated at 72 h under hypoxia (1% O2), but Mint3 mRNA expression was not affected by hypoxia until 72 h. C, Western blot analysis of FIH-1 and Mint3 expression in NP cells cultured under hypoxia for 24–72 h. Both FIH-1 and Mint3 protein levels were decreased by hypoxia. D and E, multiple blots of the experiment as described in C above were quantified by densitometric analysis. GAPDH expression was used as a loading control and to calculate relative expression level in hypoxia compared with the normoxic level. Both FIH-1 and Mint3 protein levels were decreased after a 72-h hypoxic culture. F, real-time RT-PCR analysis of HIF-1α, FIH-1, and Mint3 expression in NP cells transduced with Sh-control or Sh-HIF-1α under hypoxia. Note that the significant reduction of HIF-1α was seen in the cells transduced by Sh-HIF-1α, but FIH-1 and Mint3 expressions were not affected by HIF-1α silencing. Data represent the mean ± S.E. (error bars) of three independent experiments. *, p < 0.05.
FIGURE 3.
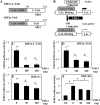
HIF transcriptional activity is suppressed by forced expression of FIH-1 in NP cells. A, schematic of Gal4 constructs of HIF-1α- and HIF-2α-TAD. B, schematic summarizing the known function of FIH-1 in controlling HIF-1 transcriptional activity. Hydroxylation of Asn803 in HIF-1α-C-TAD catalyzed by FIH-1 blocks interaction with transcriptional co-activators p300/CBP, leading to diminished HIF-1 transcriptional activity. C and D, overexpression of FIH-1 significantly decreased the HIF-1α- and HIF-2α-TAD activity in NP cells. E and F, overexpression of FIH-1 resulted in decreased HRE-Luc reporter activity under both normoxia and hypoxia in NP cells. As expected, in hypoxia the activity of HRE reporter was significantly higher than basal activity in normoxia (NX). Data represent the mean ± S.E. (error bars) of three independent experiments, each performed in triplicate. *, p < 0.05.
FIGURE 4.
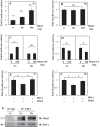
Decrease in HIF transcriptional activity by exogenous FIH-1 is rescued by Mint3 overexpression. A and B, overexpression of Mint3 in NP cells increased HRE reporter activity in normoxia (Nx) (A) but not in hypoxia (Hx) (B). C and D, the overexpression of the N terminus (Mint3-NT) (C) but not the C terminus (Mint3-CT) (D) of Mint3 is necessary and sufficient for increasing HRE reporter activity in normoxia. No increase in HRE activity was seen by either of the shorter Mint3 constructs under hypoxia. HRE activity is represented as relative change compared with the respective controls in normoxia or hypoxia. E and F, overexpression of Mint3 can rescue loss of HRE reporter activity induced by exogenous FIH-1 irrespective of pO2, suggesting that the level of endogenous FIH-1 in hypoxia is low and thus has little effect on HIF activity. Data represent mean ± S.E. of three independent experiments, each performed in triplicate (*, p < 0.05). G, immunoprecipitation (IP) of FIH-1 from rat NP cells in normoxia or hypoxia followed by Western blot analysis (IB) using Mint3 antibody indicated association between FIH-1 and Mint3. When an isotype IgG was used in place of FIH-1 antibody in normoxia, precipitation of either FIH-1 or Mint3 was absent. ns, not significant.
FIGURE 5.
Ability of the FIH-1/Mint3 system to regulate HIF activity in NP cells depends on subcellular localization. A, immunofluorescence analysis of cellular localization of FIH-1 and Mint3 in rat NP cells. Both FIH-1 and Mint3 are present in both the nucleus and cytoplasm. Propidium iodide (P.I.) was used to label cell nuclei. Scale bars, 100 μm. B, Western blot analysis of cellular localization of FIH-1 and Mint3 in NP cells. FIH-1 is localized in the cell nucleus and cytoplasm. The Mint3 level is higher in the nucleus than in the cytoplasm. Both FIH-1 and Mint3 are decreased by hypoxia in the nuclear fraction. C, cytoplasm. N, nucleus. C and D, multiple blots were quantified by densitometric analysis. Expression of GAPDH for cytoplasmic and Lamin A/C for nuclear protein was used as a loading control and to calculate relative expression levels. Hypoxia decreased nuclear levels of both FIH-1 and Mint3. E and F, reduction of HRE-Luc activity mediated by exogenous FIH-1 was abolished by treatment with ivermectin, a nuclear import inhibitor. In contrast, treatment with leptomycin B, a nuclear export inhibitor, further reduced FIH-1-dependent HRE reporter activity under both normoxia (Nx) and hypoxia (Hx). LMB, leptomycin B. Data represent mean ± S.E. (error bars) of three independent experiments. *, p < 0.05.
FIGURE 6.
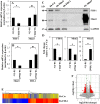
FIH-1 silencing has no effect on HIF transcriptional activity under normoxia. A and B, real-time RT-PCR analysis shows that lentiviral (LV) transduction of NP cells with Sh-FIH-1 (A) and Sh-Mint3 (B) selectively suppressed the mRNA expression of either FIH-1 or Mint3 without affecting the expression of the other. C, Western blot analysis of cells transduced with Sh-Control, Sh-Mint3, Sh-FIH-1, or FL-Mint3. The expression of FIH-1 or Mint3 was suppressed by respective shRNA compared with cells transduced with lentivirus expressing Sh-control. D, densitometric analysis of three independent experiments described in C shows that transduction of cells with Sh-FIH-1 or Sh-Mint3 significantly decreases respective expression, whereas transduction with FL-Mint3 significantly overexpressed Mint3 protein in cells. Data represent mean ± S.E. (error bars) of three independent experiments. *, p < 0.05. _E_, volcano plot of differentially expressed transcripts between cells transduced with Sh-control and Sh-FIH-1. The _x_ axis represents the log2 values of the -fold change observed for each transcript, whereas the _y_ axis depicts the log10 values of the _p_ value of the significance tests between triplicates for each transcript. Genes that demonstrate a 1.5-fold or greater difference in expression at _p_ < 0.1 in FIH-1-silenced cells compared with control cells are displayed in _red. F_, heat map and dendrogram of differentially expressed transcripts. Dendrograms are reflective of the genes with a differential expression of >1.5-fold from three independent experiments (p < 0.1). In the dendrogram, a shorter arm indicates higher similarity, whereas a longer arm indicates lower similarity. The resulting heat map of the dendrogram tree reveals groups of genes with high expression levels (red), low expression levels (blue), or background expression levels (yellow).
FIGURE 7.
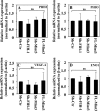
HIF activity in NP cells is refractory to FIH-1/Mint3-mediated regulation. A–D, real-time RT-PCR analysis of known HIF-1 target genes in NP cells. Stable suppression of FIH-1 or Mint3 or forced expression of Mint3 in NP cells by lentivirally delivered ShRNA or Mint3 cDNA has no effect on mRNA expression of HIF-1 target gene ELGN1 (PHD2) (A), EGLN3 (PHD3) (B), VEGA (C), or ENO1 (D) in normoxia. Data represent the mean ± S.E. (error bars) of three independent experiments. *, p < 0.05. ns, not significant.
FIGURE 8.
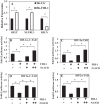
Relationship between HIFs, FIH-1, and Notch signaling pathways in NP cells. A, stable suppression of FIH-1 by Sh-FIH-1 in human NP cells alters the expression of known Notch signaling pathway genes. FIH-1-silenced NP cells show increased basal expression of HELT and NEURL3, whereas expression of RELN mRNA is decreased. B–D, Notch-ICD blocks the inhibitory effects of exogenous FIH-1 on HIF-α transactivation. Suppression of HIF-1α-TAD (B and D) and HIF-2α-TAD (C and E) activity by exogenous FIH-1 (100 ng) in NP cells is restored by co-expression of either Notch1-ICD (N1-ICD) (B and C) or Notch2-ICD (N2-ICD) (D and E) used at concentrations of 100–200 ng. Data represent the mean ± S.E. (error bars) of three independent experiments. *, p < 0.05.
Similar articles
- Mint3 enhances the activity of hypoxia-inducible factor-1 (HIF-1) in macrophages by suppressing the activity of factor inhibiting HIF-1.
Sakamoto T, Seiki M. Sakamoto T, et al. J Biol Chem. 2009 Oct 30;284(44):30350-9. doi: 10.1074/jbc.M109.019216. Epub 2009 Sep 2. J Biol Chem. 2009. PMID: 19726677 Free PMC article. - NECAB3 Promotes Activation of Hypoxia-inducible factor-1 during Normoxia and Enhances Tumourigenicity of Cancer Cells.
Nakaoka HJ, Hara T, Yoshino S, Kanamori A, Matsui Y, Shimamura T, Sato H, Murakami Y, Seiki M, Sakamoto T. Nakaoka HJ, et al. Sci Rep. 2016 Mar 7;6:22784. doi: 10.1038/srep22784. Sci Rep. 2016. PMID: 26948053 Free PMC article. - Hypoxia-inducible factor 1 regulation through cross talk between mTOR and MT1-MMP.
Sakamoto T, Weng JS, Hara T, Yoshino S, Kozuka-Hata H, Oyama M, Seiki M. Sakamoto T, et al. Mol Cell Biol. 2014 Jan;34(1):30-42. doi: 10.1128/MCB.01169-13. Epub 2013 Oct 28. Mol Cell Biol. 2014. PMID: 24164895 Free PMC article. - Signalling cross talk of the HIF system: involvement of the FIH protein.
Coleman ML, Ratcliffe PJ. Coleman ML, et al. Curr Pharm Des. 2009;15(33):3904-7. doi: 10.2174/138161209789649448. Curr Pharm Des. 2009. PMID: 19671041 Review. - Regulation of Transactivation at C-TAD Domain of HIF-1_α_ by Factor-Inhibiting HIF-1_α_ (FIH-1): A Potential Target for Therapeutic Intervention in Cancer.
Rani S, Roy S, Singh M, Kaithwas G. Rani S, et al. Oxid Med Cell Longev. 2022 May 10;2022:2407223. doi: 10.1155/2022/2407223. eCollection 2022. Oxid Med Cell Longev. 2022. PMID: 35592530 Free PMC article. Review.
Cited by
- The role of HIF proteins in maintaining the metabolic health of the intervertebral disc.
Silagi ES, Schipani E, Shapiro IM, Risbud MV. Silagi ES, et al. Nat Rev Rheumatol. 2021 Jul;17(7):426-439. doi: 10.1038/s41584-021-00621-2. Epub 2021 Jun 3. Nat Rev Rheumatol. 2021. PMID: 34083809 Free PMC article. Review. - A Review: Methodologies to Promote the Differentiation of Mesenchymal Stem Cells for the Regeneration of Intervertebral Disc Cells Following Intervertebral Disc Degeneration.
Ohnishi T, Homan K, Fukushima A, Ukeba D, Iwasaki N, Sudo H. Ohnishi T, et al. Cells. 2023 Aug 28;12(17):2161. doi: 10.3390/cells12172161. Cells. 2023. PMID: 37681893 Free PMC article. Review. - Factor inhibiting HIF1-A novel target of SUMOylation in the human placenta.
Sallais J, Alahari S, Tagliaferro A, Bhattacharjee J, Post M, Caniggia I. Sallais J, et al. Oncotarget. 2017 Dec 7;8(69):114002-114018. doi: 10.18632/oncotarget.23113. eCollection 2017 Dec 26. Oncotarget. 2017. PMID: 29371964 Free PMC article. - Defining the phenotype of young healthy nucleus pulposus cells: recommendations of the Spine Research Interest Group at the 2014 annual ORS meeting.
Risbud MV, Schoepflin ZR, Mwale F, Kandel RA, Grad S, Iatridis JC, Sakai D, Hoyland JA. Risbud MV, et al. J Orthop Res. 2015 Mar;33(3):283-93. doi: 10.1002/jor.22789. Epub 2015 Jan 21. J Orthop Res. 2015. PMID: 25411088 Free PMC article. - Hypoxia and hyperbaric oxygen therapy: a review.
Choudhury R. Choudhury R. Int J Gen Med. 2018 Nov 20;11:431-442. doi: 10.2147/IJGM.S172460. eCollection 2018. Int J Gen Med. 2018. PMID: 30538529 Free PMC article. Review.
References
- Feng H., Danfelter M., Stromqvist B., Heinegard D. (2006) Extracellular matrix in disc degeneration. J. Bone Joint Surg. Am. 88, 25–29 - PubMed
- Setton L. A., Chen J. (2006) Mechanobiology of the intervertebral disc and relevance to disc degeneration. J. Bone Joint Surg. Am. 88, 52–57 - PubMed
- Kauppila L. I. (1995) Ingrowth of blood vessels in disc degeneration. Angiographic and histological studies of cadaveric spines. J. Bone Joint Surg. Am. 77, 26–31 - PubMed
- Rajpurohit R., Risbud M. V., Ducheyne P., Vresilovic E. J., Shapiro I. M. (2002) Phenotypic characteristics of the nucleus pulposus. Expression of hypoxia inducing factor-1, glucose transporter-1 and MMP-2. Cell Tissue Res. 308, 401–407 - PubMed
- Risbud M. V., Guttapalli A., Stokes D. G., Hawkins D., Danielson K. G., Schaer T. P., Albert T. J., Shapiro I. M. (2006) Nucleus pulposus cells express HIF-1α under normoxic culture conditions. A metabolic adaptation to the intervertebral disc microenvironment. J. Cell Biochem. 98, 152–159 - PubMed
Publication types
MeSH terms
Substances
Grants and funding
- R01 AR064733/AR/NIAMS NIH HHS/United States
- AR050087/AR/NIAMS NIH HHS/United States
- T32 AR052273/AR/NIAMS NIH HHS/United States
- R01 AR050087/AR/NIAMS NIH HHS/United States
- AR064733/AR/NIAMS NIH HHS/United States
- AR055655/AR/NIAMS NIH HHS/United States
- R01 AR055655/AR/NIAMS NIH HHS/United States
LinkOut - more resources
Full Text Sources
Other Literature Sources
Molecular Biology Databases
Research Materials
Miscellaneous
