Actin and dynamin2 dynamics and interplay during clathrin-mediated endocytosis - PubMed (original) (raw)
Actin and dynamin2 dynamics and interplay during clathrin-mediated endocytosis
Alexandre Grassart et al. J Cell Biol. 2014.
Abstract
Clathrin-mediated endocytosis (CME) involves the recruitment of numerous proteins to sites on the plasma membrane with prescribed timing to mediate specific stages of the process. However, how choreographed recruitment and function of specific proteins during CME is achieved remains unclear. Using genome editing to express fluorescent fusion proteins at native levels and live-cell imaging with single-molecule sensitivity, we explored dynamin2 stoichiometry, dynamics, and functional interdependency with actin. Our quantitative analyses revealed heterogeneity in the timing of the early phase of CME, with transient recruitment of 2-4 molecules of dynamin2. In contrast, considerable regularity characterized the final 20 s of CME, during which ∼26 molecules of dynamin2, sufficient to make one ring around the vesicle neck, were typically recruited. Actin assembly generally preceded dynamin2 recruitment during the late phases of CME, and promoted dynamin recruitment. Collectively, our results demonstrate precise temporal and quantitative regulation of the dynamin2 recruitment influenced by actin polymerization.
© 2014 Grassart et al.
Figures
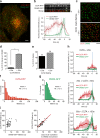
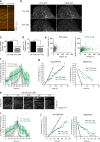
Figure 1.
Dynamin2 recruitment to endocytic sites. (a) TIRF microscopy image of a representative SK-MEL-2 hCLTAEN/hDNM2EN cell expressing both CLTA-RFP and DNM2-EGFP. Bar, 5 µm. (b) Representative montage (top) and average fluorescence intensity profile (bottom) for endocytic events (tracks = 42; n = 3 cells). Shaded bars represent SEM. Bar, 500 nm. (c) Representative overlays of a cropped region (10 × 10 µm) of cell imaged for 120 frames (240 s) in which all DNM2-GFP tracks (in green) are displayed (identically in both images), whereas CLTA-RFP tracks (in red) are segmented by lifetime and displayed as tracks <20 s or >20 s on top or bottom images, respectively. Bar, 2 µm. (d) The mean percentage of CLTA punctae (±SEM), of <20 s or >20 s duration, that display robust dynamin recruitment (tracks = 903 or 815, respectively; n = 5 cells; *, P < 0.0001). (e) The percentage of CLTA punctae having lifetimes <20 s or >20 s (tracks = 21,455; n = 5 cells). (f and g) Global lifetime distribution of CLTA-RFP and DNM2-GFP punctae (mean = 48 ± 1.4 s or 18 ± 1.6 s, respectively; tracks = 21,455 or 1,706, respectively; n = 5 or 3 cells, respectively). (h) Representative fluorescence intensity profiles of CLTA-RFP and DNM2-GFP for clathrin tracks <20 s (top), 20–60 s (middle), or 60–100 s (bottom). Blue line denotes time of maximum DNM2-GFP fluorescence (tracks = 10). (i) CLTA-RFP–DNM2-GFP punctae lifetime dot plot (left) and CLTA-RFP punctae lifetime relative to time from endocytic site initiation to maximum DNM2-GFP fluorescence. Each dot represents a single endocytic event (tracks analyzed = 46).
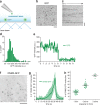
Figure 2.
Quantitation of dynamin2 recruitment to endocytic sites. (a) Schematic representation of the TIRF imaging setup used for the experiments. This illustration shows that purified eGFP molecules were deposited at a low surface density on a polylysine-coated coverslip. After extensive washes, molecules were illuminated continuously with TIRF and recorded at a frequency of 10 Hz. (b) Frame from a TIRF acquisition time-series obtained using 100-ms exposures. The spots represent eGFP molecules. Bar, 1 µm. (c) Representative kymograph from a time-series of eGFP imaging. Bar, 1 µm. (d) Distribution of eGFP intensity measured (n = 215). (e) Representative fluorescence intensity trace corresponding to single bleaching step. (f) Frame from a TIRF acquisition time-series for a genome-edited DNM2EN-all SK-MEL-2 cell line endogenously expressing DNM2-GFP. Bar, 5 µm. (g) Average number of DNM2-GFP molecules recruited at the plasma membrane as a function of time (n = 40 endocytic sites in 3 cells). (h) Distribution of dynamin2 molecules in function of the theoretical capacity to form helices (n = 40 in 3 cells).
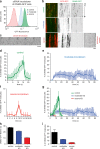
Figure 3.
Concentration dependence of dynamin2 recruitment to endocytic sites. (a) Representative histogram plot of GFP fluorescence intensity for cell populations analyzed by FACS. Cells were subjected to treatment with mock siRNAs or siRNAs targeted to dynamin2, and were sorted 3 d after treatment by FACS for moderate or severe DNM2-GFP knockdown. For the experiment shown, number of events analyzed = 24,467 (control), 29,711 (moderate), and 16,286 (severe). (b) Kymograph analysis of representative cells subjected to varying degrees (control, moderate, or severe) of DNM2-GFP depletion. CLTA-RFP is red and DNM2-GFP is green. Enhanced = increased contrast image for severe depletion condition. Time, 180 s. Bar, 2 µm. (c) Representative montage of a region of a cell subjected to severe dynamin2 depletion. DNM2-GFP is shown. Contrast of images was enhanced for better visualization. Time = 2 s/frame. Bar, 5 µm. (d–f) Average DNM2-GFP molecule recruitment (±SD) profiles showing number of molecules as a function of time for cells subjected to varying degrees of dynamin depletion in an all-DNM2 allele GFP-tagged SK-MEL-2 cell line (n = 15, 17, 22). (g) Overlay of profiles in d–f. Green indicates control, blue moderate, and red severe knockdown conditions. (h) Average DNM2-GFP lifetime (±SEM) in control, moderate, or severe DNM2-GFP knockdown conditions (n = 3,386, 1,519, 1,704; 9 cells) from CLTA- and DNM2-edited cell line. (i) Average of maximum DNM2-GFP molecules recruited (±SD) in control, moderate, or severe DNM2-GFP knockdown conditions (n = 15, 17, 22).
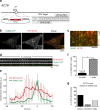
Figure 4.
Actin dynamics in genome-edited SK-MEL-2 cells. (a) Schematic overview depicting the targeting strategy for integration of Tag-RFP-t (RFP) at the β-actin (ACTB) genomic locus. White boxes represent ACTB exons. HA, donor plasmid region of homology to ACTB sequence. Blue letters, start codon. (b) TIRF microscopy image of a representative SK-MEL-2 hDNM2/hACTBEN cell expressing both DNM2-GFP and RFP-ACTB. Yellow box defines inset. Bars: (main panels) 10 µm; (insets) 2 µm. (c) Representative kymograph depicting endocytic events with dynamin-GFP (in green) and RFP-ACTB (in red). Bar, 5 µm. (d) Representative montage of an endocytic event. Bar, 1 µm. (e) Average DNM2-GFP and RFP-ACTB fluorescence intensity (±SD) profile (tracks = 10; 3 cells). (f) Percentage of DNM2-GFP punctae (±SEM) displaying RFP-ACTB recruitment (number of tracks analyzed = 645; n = 3 cells; *, P < 0.0001). (g) Percentage of RFP-ACTB (±SEM) punctae arriving before, coincident, or after DNM2-GFP arrival (number of tracks analyzed = 100; n = 3 cells).
Figure 5.
Effects of actin inhibitors on dynamin kinetics. (a and b) Representative TIRF microscopy kymograph analysis (a; time = 2 s/pixel, 360 s total) and maximum intensity projection of fluorescence over time, and (b) of a SK-MEL-2 hCLTAEN/hDNM2EN cell subjected to acute 1 µM jasplakinolide exposure. White line in panel a marks time of drug addition. A maximum intensity projection of fluorescence intensity over time (b; of imaging duration = 120 s) was generated for each condition ending or beginning 30 s before or after drug exposure, respectively. Number of punctae analyzed = 323 and 245, respectively. Bars: (a) 5 µm; (b) 2 µm. (c) Relative number of DNM2-GFP membrane punctae (±SEM), both dim and bright, before and after 1 µM jasplakinolide exposure (number of punctae analyzed = 369 and 134, respectively; n = 3 cells; *, P = 0.0005). (d) Relative DNM2-GFP initiation rate (±SEM) before and after 1 µM jasplakinolide exposure (number of tracks analyzed = 1,150 and 450, respectively; n = 3 cells; *, P = 0.0001). (e) Maximum fluorescence intensity/lifetime dot plot for DNM2-GFP tracks before and after 1 µM jasplakinolide exposure. Each dot represents a single DNM2 track (number of tracks analyzed = 1,017 and 641, respectively). Imaging began 180 s before drug addition, and terminated 180 s after drug addition. Tracks existing within these time frames (before and after drug addition) were analyzed. (f) Average number of DNM2-GFP molecules recruited to endocytic sites as a function of time in cells subjected to 1 µM of jasplakinolide or control conditions (n = 15). (g) Slope of DNM2-GFP recruitment and departure in cells subjected to 1 µM of jasplakinolide or control conditions. (h) Representative TIRF microscopy kymograph analysis of DNM2-GFP fluorescence over time in SK-MEL-2 hCLTAEN/hDNM2EN cells exposed to varying concentrations (0–1.0 µM) of latrunculin A actin assembly inhibitor. Drug exposure begins at kymograph start and continues throughout entire kymograph. (i) Average number of DNM2-GFP molecules recruited to endocytic sites as a function of time in cells subjected to 0.1 µM of latrunculin A or control conditions (n = 15). (j) Slope of recruitment and departure of DNM2-GFP in cells subjected to 1 µM of jasplakinolide or control conditions (n = 15).
Figure 6.
Model for dynamin2 and actin dynamics and interplay during clathrin-mediated endocytosis. Points in the pathway affected by dynamin or actin perturbation are indicated.
Similar articles
- Quantitative and Statistical Study of the Dynamics of Clathrin-Dependent and -Independent Endocytosis Reveal a Differential Role of EndophilinA2.
Bertot L, Grassart A, Lagache T, Nardi G, Basquin C, Olivo-Marin JC, Sauvonnet N. Bertot L, et al. Cell Rep. 2018 Feb 6;22(6):1574-1588. doi: 10.1016/j.celrep.2018.01.039. Cell Rep. 2018. PMID: 29425511 - Real-time analysis of clathrin-mediated endocytosis during cell migration.
Rappoport JZ, Simon SM. Rappoport JZ, et al. J Cell Sci. 2003 Mar 1;116(Pt 5):847-55. doi: 10.1242/jcs.00289. J Cell Sci. 2003. PMID: 12571282 - Dynamin2 and cortactin regulate actin assembly and filament organization.
Schafer DA, Weed SA, Binns D, Karginov AV, Parsons JT, Cooper JA. Schafer DA, et al. Curr Biol. 2002 Oct 29;12(21):1852-7. doi: 10.1016/s0960-9822(02)01228-9. Curr Biol. 2002. PMID: 12419186 Free PMC article. - Actin dynamics and endocytosis in yeast and mammals.
Galletta BJ, Mooren OL, Cooper JA. Galletta BJ, et al. Curr Opin Biotechnol. 2010 Oct;21(5):604-10. doi: 10.1016/j.copbio.2010.06.006. Epub 2010 Jul 14. Curr Opin Biotechnol. 2010. PMID: 20637595 Free PMC article. Review. - Seeing is believing: imaging actin dynamics at single sites of endocytosis.
Merrifield CJ. Merrifield CJ. Trends Cell Biol. 2004 Jul;14(7):352-8. doi: 10.1016/j.tcb.2004.05.008. Trends Cell Biol. 2004. PMID: 15246428 Review.
Cited by
- Emerging Roles of Small Extracellular Vesicles in Gastrointestinal Cancer Research and Therapy.
Schneider N, Hermann PC, Eiseler T, Seufferlein T. Schneider N, et al. Cancers (Basel). 2024 Jan 29;16(3):567. doi: 10.3390/cancers16030567. Cancers (Basel). 2024. PMID: 38339318 Free PMC article. Review. - Imaging the recruitment and loss of proteins and lipids at single sites of calcium-triggered exocytosis.
Trexler AJ, Sochacki KA, Taraska JW. Trexler AJ, et al. Mol Biol Cell. 2016 Aug 1;27(15):2423-34. doi: 10.1091/mbc.E16-01-0057. Epub 2016 Jun 15. Mol Biol Cell. 2016. PMID: 27307587 Free PMC article. - 4D cell biology: big data image analytics and lattice light-sheet imaging reveal dynamics of clathrin-mediated endocytosis in stem cell-derived intestinal organoids.
Schöneberg J, Dambournet D, Liu TL, Forster R, Hockemeyer D, Betzig E, Drubin DG. Schöneberg J, et al. Mol Biol Cell. 2018 Nov 26;29(24):2959-2968. doi: 10.1091/mbc.E18-06-0375. Epub 2018 Sep 6. Mol Biol Cell. 2018. PMID: 30188768 Free PMC article. - Induced nanoscale membrane curvature bypasses the essential endocytic function of clathrin.
Cail RC, Shirazinejad CR, Drubin DG. Cail RC, et al. J Cell Biol. 2022 Jul 4;221(7):e202109013. doi: 10.1083/jcb.202109013. Epub 2022 May 9. J Cell Biol. 2022. PMID: 35532382 Free PMC article. - Mononuclear phagocyte system blockade improves therapeutic exosome delivery to the myocardium.
Wan Z, Zhao L, Lu F, Gao X, Dong Y, Zhao Y, Wei M, Yang G, Xing C, Liu L. Wan Z, et al. Theranostics. 2020 Jan 1;10(1):218-230. doi: 10.7150/thno.38198. eCollection 2020. Theranostics. 2020. PMID: 31903116 Free PMC article.
References
Publication types
MeSH terms
Substances
LinkOut - more resources
Full Text Sources
Other Literature Sources
