Novel somatic and germline mutations in intracranial germ cell tumours - PubMed (original) (raw)
. 2014 Jul 10;511(7508):241-5.
doi: 10.1038/nature13296. Epub 2014 Jun 4.
Shigeru Yamaguchi 2, Matthew D Burstein 3, Keita Terashima 4, Kyle Chang 1, Ho-Keung Ng 5, Hideo Nakamura 6, Zongxiao He 7, Harshavardhan Doddapaneni 1, Lora Lewis 1, Mark Wang 1, Tomonari Suzuki 8, Ryo Nishikawa 8, Atsushi Natsume 9, Shunsuke Terasaka 10, Robert Dauser 11, William Whitehead 11, Adesina Adekunle 12, Jiayi Sun 13, Yi Qiao 14, Gábor Marth 14, Donna M Muzny 1, Richard A Gibbs 1, Suzanne M Leal 7, David A Wheeler 1, Ching C Lau 15
Affiliations
- PMID: 24896186
- PMCID: PMC4532372
- DOI: 10.1038/nature13296
Novel somatic and germline mutations in intracranial germ cell tumours
Linghua Wang et al. Nature. 2014.
Abstract
Intracranial germ cell tumours (IGCTs) are a group of rare heterogeneous brain tumours that are clinically and histologically similar to the more common gonadal GCTs. IGCTs show great variation in their geographical and gender distribution, histological composition and treatment outcomes. The incidence of IGCTs is historically five- to eightfold greater in Japan and other East Asian countries than in Western countries, with peak incidence near the time of puberty. About half of the tumours are located in the pineal region. The male-to-female incidence ratio is approximately 3-4:1 overall, but is even higher for tumours located in the pineal region. Owing to the scarcity of tumour specimens available for research, little is currently known about this rare disease. Here we report the analysis of 62 cases by next-generation sequencing, single nucleotide polymorphism array and expression array. We find the KIT/RAS signalling pathway frequently mutated in more than 50% of IGCTs, including novel recurrent somatic mutations in KIT, its downstream mediators KRAS and NRAS, and its negative regulator CBL. Novel somatic alterations in the AKT/mTOR pathway included copy number gains of the AKT1 locus at 14q32.33 in 19% of patients, with corresponding upregulation of AKT1 expression. We identified loss-of-function mutations in BCORL1, a transcriptional co-repressor and tumour suppressor. We report significant enrichment of novel and rare germline variants in JMJD1C, which codes for a histone demethylase and is a coactivator of the androgen receptor, among Japanese IGCT patients. This study establishes a molecular foundation for understanding the biology of IGCTs and suggests potentially promising therapeutic strategies focusing on the inhibition of KIT/RAS activation and the AKT1/mTOR pathway.
Figures
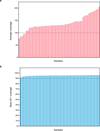
Extended Data Figure 1. The performance of whole-exome sequencing
a, The average read coverage across all samples in the discovery study. b, The base 20+ coverage. Base 20+ coverage, the percentage of targeted bases that were covered by at least 20 sequencing reads.
Extended Data Figure 2. The number and rate of validated somatic mutations
a, The number of validated somatic nonsynonymous mutations across all tumors in the discovery study. b, The rate of somatic non-silent mutations across all tumors in the discovery study. c, The mutation rate of NGGCTs. Only validated non-silent somatic mutations were counted. Blue filled circles, mature teratomas; Green filled circle, tumor defined as NGGCT but without detail information for subtype; Brown filled circles, immature teratomas; Red filled circles, yolk sac tumors. It is of note that M1 tumor is a mixture of germinoma and yolk sac tumor thus was included here. Mature teratomas, which are considered as histologically benign tumors, have the lowest mutation rate, followed by immature teratomas (0.1/Mb). Yolk sac tumors have the highest mutation rates (0.6/Mb).
Extended Data Figure 3. The mRNA expression levels of KIT
The mRNA expression levels were determined by Affymetrix U133Plus2 human gene expression array for 37 out of the total 62 IGCT tumors with available RNA. Red dots, tumors with somatic mutation of KIT; green dot, tumor with somatic CBL mutation and was wildtype for KIT; G, pure germinomas; Mixed, mixed germ cell tumors with germinoma component; NGGCT, nongerminomatous germ cell tumors. P-value was calculated using one-way ANOVA analysis.
Extended Data Figure 4. The somatic mutations identified in KRAS and NRAS
a, The distribution of somatic mutations identified in KRAS and NRAS. The positions and amino acid changes were indicated for each mutation. b, KRAS/NRAS mutations are mutually exclusive with mutations in KIT. Two-by-Two table showing that mutations in KIT and KRAS/NRAS were mutually exclusive. Left-tailed Fisher’s exact test was applied to calculate the p value. P=0.018.
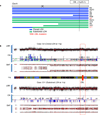
Extended Data Figure 5. The clonal and subclonal loss of heterozygosity events on chromosome 11q (11qLOH)
a, Topographic maps showing regions of clonal or subclonal 11qLOH spanning the CBL locus in individual patients. b, The clonal and subclonal 11qLOH in two representative cases G4 and G11. The red rectangle indicates the CBL locus. BAF, B allele frequency; LRR, Log2 R ratio; CN, copy number.
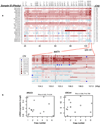
Extended Data Figure 6. Recurrent DNA copy number gains at 14q32 identified in the discovery study
a, Recurrent focal amplification of 14q32.33 spanning the AKT1 locus. Regions of absolute DNA copy number are plotted for 14q (top panel) and 14q32.33 spanning the AKT1 locus (bottom panel). Each row represents an individual tumor. Tumors were sorted descendingly by their absolute copy number within the boundaries of AKT1 (indicated to the right). The mean copy number across chromosomes 1–22 (ploidy) is indicated alongside the tumor IDs on the left. The _x_-axis shows chromosome 14 genomic locations in megabase pairs (Mbp). CN, copy number inferred by Omni2.5 SNP array. b, The correlation between the DNA copy number status and levels of mRNA expression of two representative genes, XRCC3 and CDCA4, presented in focal amplified region 14q32.33. The P-value across all groups was calculated by Spearman’s rank-order correlation analysis. Rho, the Spearman’s correlation coefficient.
Extended Data Figure 7. The workflow for filtering of germline variants
Germline variants were filtered step by step to pick up the potentially interesting candidates. First, select the non-silent variants including missense, nonsense, frameshift, and splice-site variants. Second, select the high-confident variants that meet the following criteria: 1) variant allele fraction in both tumor and normal equal to or greater than 0.20; 2) variant calling were supported by at least 4 sequencing reads for both tumor and normal samples. Third, select novel variants that have not been reported in dbSNP database (dbSNP135). Then, select genes with COSMIC evidence, i.e. genes for which mutations have been reported in COSMIC database in at least 100 times. After that, for all 1876 genes left in the above list, calculate the fold of enrichment of the germline variants in Japanese IGCT patients by comparing its frequency to that of Japanese patients in the control cohort and performed Fisher’s exact test to calculate the p values. Then, select potentially interesting genes based on the IGCT frequency bias (>=4) and significant p-values (<0.05).
Extended Data Figure 8. The mRNA expression levels of JMJD1C and AR in IGCT
a, The mRNA expression levels of JMJD1C. b, The mRNA expression levels of AR. The mRNA expression levels were determined by Affymetrix U133Plus2 human gene expression array for 37 out of the total 62 tumors with available RNA. Left, the expression level of JMJD1C or AR in all IGCT tumors analyzed; middle and right, the expression level of JMJD1C or AR comparing to other known genes in representative tumors. Selected genes were highlighted in different colors and the remaining genes were colored in gray. The red dash lines indicate median values of expression.
Extended Data Figure 9. Subgroup specificity of LOH and chromosomal imbalance in IGCT
Summary of the gross chromosomal alterations based on genome-wide Illumina Omni2.5 SNP array. Ploidy was predicted by Genome Alteration Print (GAP) algorithm. Chromosomal imbalances are represented by the change of B-allele frequency (BAF) pattern with or without the loss of heterozygosity (LOH). G, germinoma; NGGCT, nongerminomatous germ cell tumor; M, Mixed GCTs with germinoma component.
Extended Data Figure 10. An overview of the subclonal signatures across all tumors in the discovery study
Those cases without SNP array data or without detectable copy number changes were excluded for clonality analysis. Each peak in the plot indicates a subclone. The x axis indicates mBAF and the y axis indicate the number of heterozygous SNPs. Those cases with single peak are monoclonal and those with multiple peaks are polyclonal. Some subclones were highlighted, such as the subclone in G4, for a better visualization. The amplitude of the peaks in the plot has nothing to do with the fractions of cells that are harboring each event.
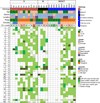
Figure 1. Subgroup specificity of the recurrent genetic alterations identified in 62 IGCT patients
G, germinoma; NGGCT, nongerminomatous germ cell tumor; M, mixed germ cell tumor with germinoma component. Several genes were included that are mutated once but considered biologically important by one of the following criteria: involvement in KIT/RAS or AKT/mTOR pathways, known interaction with KIT, tumor suppressor genes with two hits. Germline variants in JMJD1C were either novel or rare polymorphisms with minor allele frequency less than 0.005. qPCR of AKT1 was validated if the gene count adjusted by ploidy was great than 3.
Figure 2. Novel recurrent somatic and germline mutations in IGCT
a, Somatic KIT mutations. Red lettering, the novel KIT mutations identified in IGCT; black lettering, reported KIT mutations; Black filled circles, the number of mutations identified at each mutation site. The primary KIT mutations reported in gastrointestinal stromal tumors are shown for comparison. Functional domains: ED, extracellular domain; JM, juxtamembrane domain; TK1, tyrosine kinase I, the ATP binding domain; TK2, tyrosine kinase II, the kinase activation loop (A-loop). The sensitivity of known tyrosine kinase inhibitors (TKIs), corresponding to each mutation site from previous studies performed in other tumor types are shown on the right. IM, Imatinib; SU, Sunitinib, SO, sorafenib; NI, nilotinib; MI, Midostaurin; DA, Dasatanib. KIT exon-11 mutations are generally sensitive to Imatinib. Certain Imatinib-resistant KIT mutations respond to Sunitinib and Sorafenib. More than half of KIT mutations in IGCTs reside in the A-loop (Supplementary Figure 3). The D816 mutation causes KIT to be constitutively activated by altering the structure of the JM domain and destabilizing the A-loop inactive conformation. Tumors with D816-mutated KIT respond well to Midostaurin. b, Schematic representation of somatic mutations in CBL, MTOR, BCORL1, and germline variants identified in JMJD1C. DNP, dinucleotide polymorphism; Rapa, rapamycin binding site; PI3-PI4, PI3-PI4 kinase; CtBP, CtBP binding site; NLS, nuclear localization signal; LXXLL motif, L is Leucine and X is any amino acid. Only novel or rare JMJD1C germline variants (MAF<0.005) are shown.
Figure 3. Frequent genetic alteration of KIT/RAS and AKT/mTOR signaling pathways
a, Summary of the somatic events. b, KIT/RAS and AKT/mTOR pathway interactions showing frequencies of somatic alterations in key genes. Alteration frequencies are expressed as a percentage of all IGCT patients. Red lettering, protein positively regulates signaling; blue lettering, protein negatively regulates signaling, and green lettering, physically interacting protein. c, the correlation of AKT1 copy number status and levels of AKT1 mRNA expression. AKT1 copy number status was assayed by SNP array and validated by qPCR. The mRNA expression levels were determined by Affymetrix U133Plus2 human gene expression array. The red lines indicate mean values of expression. The P-value across all groups calculated by Spearman’s rank-order correlation analysis is 0.001 and the correlation coefficient is 0.5614. The P values between two different groups calculated by one-way ANOVA analysis are shown. d, Immunohistochemical staining of AKT1 in AKT1 amplified tumors. Immunostaining was carried out with AKT1-specifc goat antibody D-17 (sc7126, Santa-Cruz Biotechnology) at 1:75 dilution. Magnification: 400X. Scale bar: 50 µm. Cases M3 and NG5 showed strong and diffuse cytoplasmic and nuclear staining while cases G4, NG2 and NG13 showed strong but focal cytoplasmic and nuclear staining.
Figure 4. Enrichment of germline JMJD1C variants in IGCT
Only validated novel or rare (MAF< 0.005) non-silent germline variants were counted. JP, Japanese. Healthy controls were from the 1000 Genomes Project (n=1092,
). A panel of 778 unrelated cancers sequenced at HGSC (cancer types =10, from both Asia and United States) were used as the cancer control. The one-sided Fisher’s exact test was performed to test the enrichment of the minor alleles in IGCT cases.
Similar articles
- Mutually exclusive mutations of KIT and RAS are associated with KIT mRNA expression and chromosomal instability in primary intracranial pure germinomas.
Fukushima S, Otsuka A, Suzuki T, Yanagisawa T, Mishima K, Mukasa A, Saito N, Kumabe T, Kanamori M, Tominaga T, Narita Y, Shibui S, Kato M, Shibata T, Matsutani M, Nishikawa R, Ichimura K; Intracranial Germ Cell Tumor Genome Analysis Consortium (iGCT Consortium). Fukushima S, et al. Acta Neuropathol. 2014;127(6):911-25. doi: 10.1007/s00401-014-1247-5. Epub 2014 Jan 23. Acta Neuropathol. 2014. PMID: 24452629 - The genetic landscape of 87 ovarian germ cell tumors.
Van Nieuwenhuysen E, Busschaert P, Neven P, Han SN, Moerman P, Liontos M, Papaspirou M, Kupryjanczyk J, Hogdall C, Hogdall E, Oaknin A, Garcia A, Mahner S, Trillsch F, Cibula D, Heitz F, Concin N, Speiser P, Salvesen H, Sehouli J, Lambrechts D, Vergote I. Van Nieuwenhuysen E, et al. Gynecol Oncol. 2018 Oct;151(1):61-68. doi: 10.1016/j.ygyno.2018.08.013. Epub 2018 Aug 28. Gynecol Oncol. 2018. PMID: 30170975 - Whole-exome sequencing has revealed novel genetic characteristics in intracranial germ cell tumours in the Chinese.
Huang X, Huang J, Zhou X, Zhang C, Ding X, Wong PJC, Wang Y, Zhang R. Huang X, et al. Histopathology. 2024 Jun;84(7):1199-1211. doi: 10.1111/his.15155. Epub 2024 Feb 26. Histopathology. 2024. PMID: 38409885 - Advances in genetic abnormalities, epigenetic reprogramming, and immune landscape of intracranial germ cell tumors.
Zhang Y, Zhong C, Ke X, Liu J, Ye Z, Lu L, Deng K, Zhu H, Yao Y. Zhang Y, et al. Acta Neuropathol Commun. 2023 Nov 27;11(1):188. doi: 10.1186/s40478-023-01682-y. Acta Neuropathol Commun. 2023. PMID: 38012690 Free PMC article. Review. - Recent advances in molecular biology and treatment strategies for intracranial germ cell tumors.
Huang X, Zhang R, Mao Y, Zhou LF, Zhang C. Huang X, et al. World J Pediatr. 2016 Aug;12(3):275-282. doi: 10.1007/s12519-016-0021-2. Epub 2016 Jun 29. World J Pediatr. 2016. PMID: 27351562 Review.
Cited by
- Pathogenesis of central nervous system germ cell tumors.
Liu S, Ren L, Gao X, Hao M, Wang G. Liu S, et al. Front Oncol. 2022 Sep 9;12:991484. doi: 10.3389/fonc.2022.991484. eCollection 2022. Front Oncol. 2022. PMID: 36158643 Free PMC article. Review. - Pluripotency transcription factor Oct4 mediates stepwise nucleosome demethylation and depletion.
Shakya A, Callister C, Goren A, Yosef N, Garg N, Khoddami V, Nix D, Regev A, Tantin D. Shakya A, et al. Mol Cell Biol. 2015 Mar;35(6):1014-25. doi: 10.1128/MCB.01105-14. Epub 2015 Jan 12. Mol Cell Biol. 2015. PMID: 25582194 Free PMC article. - Predicting Gonadal Germ Cell Cancer in People with Disorders of Sex Development; Insights from Developmental Biology.
Looijenga LHJ, Kao CS, Idrees MT. Looijenga LHJ, et al. Int J Mol Sci. 2019 Oct 10;20(20):5017. doi: 10.3390/ijms20205017. Int J Mol Sci. 2019. PMID: 31658757 Free PMC article. Review. - The Japan Society for Neuro-Oncology guideline on the diagnosis and treatment of central nervous system germ cell tumors.
Nakamura H, Takami H, Yanagisawa T, Kumabe T, Fujimaki T, Arakawa Y, Karasawa K, Terashima K, Yokoo H, Fukuoka K, Sonoda Y, Sakurada K, Mineharu Y, Soejima T, Fujii M, Shinojima N, Hara J, Yamasaki K, Fujimura J, Yamasaki F, Takahashi M, Suzuki T, Sato I, Nishikawa R, Sugiyama K. Nakamura H, et al. Neuro Oncol. 2022 Apr 1;24(4):503-515. doi: 10.1093/neuonc/noab242. Neuro Oncol. 2022. PMID: 34671804 Free PMC article. - Final report of the phase II NEXT/CNS-GCT-4 trial: GemPOx followed by marrow-ablative chemotherapy for recurrent intracranial germ cell tumors.
Shatara M, Blue M, Stanek J, Liu YA, Prevedello DM, Giglio P, Puduvalli VK, Gardner SL, Allen JC, Wong KK, Nelson MD, Gilles FH, Adams RH, Pauly J, O'Halloran K, Margol AS, Dhall G, Finlay JL. Shatara M, et al. Neurooncol Pract. 2023 Oct 14;11(2):188-198. doi: 10.1093/nop/npad067. eCollection 2024 Apr. Neurooncol Pract. 2023. PMID: 38496907 Free PMC article.
References
- Packer RJ, Cohen BH, Cooney K. Intracranial germ cell tumors. The oncologist. 2000;5:312–320. - PubMed
- Jennings MT, Gelman R, Hochberg F. Intracranial germ-cell tumors: natural history and pathogenesis. Journal of neurosurgery. 1985;63:155–167. - PubMed
- Matsutani M, et al. Primary intracranial germ cell tumors: a clinical analysis of 153 histologically verified cases. Journal of neurosurgery. 1997;86:446–455. - PubMed
- Kamakura Y, Hasegawa M, Minamoto T, Yamashita J, Fujisawa H. C-kit gene mutation: common and widely distributed in intracranial germinomas. Journal of neurosurgery. 2006;104:173–180. - PubMed
SUPPLEMENTARY REFERENCES
Publication types
MeSH terms
Substances
Grants and funding
- 5U54HG003273/HG/NHGRI NIH HHS/United States
- U54 HG003273/HG/NHGRI NIH HHS/United States
- 5T15 LM07093-19/LM/NLM NIH HHS/United States
- T15 LM007093/LM/NLM NIH HHS/United States
- 5T15 LM07093-18/LM/NLM NIH HHS/United States
LinkOut - more resources
Full Text Sources
Other Literature Sources
Medical
Miscellaneous


