Lipocalin 2 regulates brown fat activation via a nonadrenergic activation mechanism - PubMed (original) (raw)
Lipocalin 2 regulates brown fat activation via a nonadrenergic activation mechanism
Yuanyuan Zhang et al. J Biol Chem. 2014.
Abstract
In this study, we report that lipocalin 2 (Lcn2), a recently characterized adipokine/cytokine, is a novel regulator of brown adipose tissue (BAT) activation by modulating the adrenergic independent p38 MAPK-PGC-1α-UCP1 pathway. Global Lcn2 knock-out (Lcn2(-/-)) mice have defective BAT thermogenic activation caused by cold stimulation and decreased BAT activity under high fat diet-induced obesity. Nevertheless, Lcn2(-/-) mice maintain normal sympathetic nervous system activation as evidenced by normal catecholamine release and lipolytic activity in response to cold stimulation. Further studies showed that Lcn2 deficiency impairs peroxisomal and mitochondrial oxidation of lipids and attenuates cold-induced Pgc1a and Ucp1 expression and p38 MAPK phosphorylation in BAT. Moreover, in vitro studies showed that Lcn2 deficiency reduces the thermogenic activity of brown adipocytes. Lcn2(-/-) differentiated brown adipocytes have significantly decreased expression levels of brown fat markers, decreased p38 MAPK phosphorylation, and decreased mitochondrial oxidation capacity. However, Lcn2(-/-) brown adipocytes have normal norepinephrine-stimulated p38 MAPK and hormone-sensitive lipase phosphorylation and Pgc1a and Ucp1 expression, suggesting an intact β-adrenergic signaling activation. More intriguingly, recombinant Lcn2 was able to significantly stimulate p38 MAPK phosphorylation in brown adipocytes. Activating peroxisome proliferator-activated receptor γ, a downstream effector of PGC-1α, by thiazolidinedione administration fully reverses the BAT function of Lcn2(-/-) mice. Our findings provide evidence for the novel role Lcn2 plays in oxidative metabolism and BAT activation via an adrenergic independent mechanism.
Keywords: Adipose Tissue; Brown Adipose Tissue; Gene Knock-out; Lipocalin 2; Mitochondria; Mitochondrial Biogenesis and Oxidation; Peroxisomal Oxidation; Peroxisome; Thermogenesis; p38 MAPK.
© 2014 by The American Society for Biochemistry and Molecular Biology, Inc.
Figures
FIGURE 1.
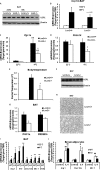
Cold-induced activation of BAT thermogenesis is impaired in _Lcn2_−/− mice. A, body temperature in _Lcn2_−/− mice during acute cold exposure (n = 9–12). B, Lcn2 protein expression in BAT of normal mice by cold stimulation (each lane represents an individual animal). C, serum glucose levels (n = 5–8); D, lactate levels (n = 5–8); E, liver glycogen content (n = 5–7); F, serum catecholamine levels (n = 7–9). G, HSL phosphorylation at Ser-563 in BATs and WATs during cold exposure (each lane represents an individual animal). Glycerol release from BAT explants (H) and WAT explants (I) are in response to NE or Iso, respectively. The data are presented as mean ± S.E. Experiments were repeated on two to four independent sets of mice, yielding similar results. *, p < 0.05; **, p < 0.01. * indicates comparison between genotypes.
FIGURE 2.
Cold- and HFD-induced thermogenic activation of BAT in _Lcn2_−/− mice. A, cold-induced UCP1 protein expression in BAT (each lane represents an individual animal); B, cold-induced mRNA expression of UCP1; C, PGC-1α (n = 4–5 mice); D, PRDM16 (n = 4–5 mice); E, rectal temperature of HFD-fed WT and _Lcn2_−/− mice (n = 14); F, UCP1 protein expression in BAT of _Lcn2_−/− mice (each lane represents an individual animal); G, mRNA expression of PGC-1α and PRDM16 in BAT of _Lcn2_−/− mice; H, H&E staining of BAT of _Lcn2_−/− mice; I, mRNA expression of M2 macrophage markers in BAT of cold-induced mice (n = 4–5 mice); J, mRNA expression of M2 macrophage markers in differentiated brown adipocytes with IL-4 treatment. The data are presented as means ± S.E. The experiments were repeated 2–3 times with different sets of animals and SV cell cultures, yielding similar results. *, p < 0.05; **, p < 0.01. * indicates comparison between genotypes.
FIGURE 3.
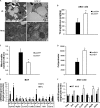
Mitochondrial biogenesis and function in BAT of Lcn2−/− mice during cold exposure. A, transmission electron microscopy of brown adipocytes (n = 4); B, TG content of BAT (n = 6). Mito, mitochondria; TG, triglyceride. Quantitative analysis is shown of the number of mitochondria per cell area (C) and the perimeter of brown adipocytes (D) from mice exposed to 4 °C for 4 h (n = 4). The mRNA expression is shown of mitochondrial genes in BAT (E) and skeletal muscle (F) of mice (n = 4–6). The data are presented as mean ± S.E. * or #, p < 0.05; **, p < 0.01. * indicates comparison between genotypes, and # indicates comparison between treatments.
FIGURE 4.
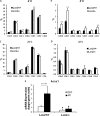
Impairment of peroxisomal metabolism of VLCFAs in BAT of _Lcn2_−/− mice. A–D, fatty acid composition of TAG in BAT of _Lcn2_−/− mice (n = 6–7). E, mRNA expression levels of Acox1 gene in BAT (n = 4). The data are presented as mean ± S.E. **, p < 0.01. #, p < 0.05. # in panel E indicates difference between phenotypes.
FIGURE 5.
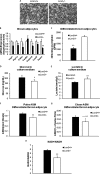
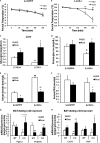
Functional assessment of differentiated brown adipocytes. A, morphology of primary brown adipocytes differentiated from SV cells. B, mRNA expression of brown adipocyte markers in primary differentiated brown adipocytes. 2-Deoxyglucose uptake (C), glucose levels (D), and lactate levels (E) in the culture medium of differentiated brown adipocytes. Oxidation is shown for 14C-labeled oleate in pulse (F) and chase phase (G) and the ratio of NAD+/NADH (H) in differentiated brown adipocytes. The data are presented as mean ± S.E. and represent two to three independent experiments. In each experiment, SV cells were isolated from BAT of 3–4 mice. Pulse ASM, acid-soluble metabolites in pulse phase. * p < 0.05; **, p < 0.01. * indicates comparison between genotypes.
FIGURE 6.
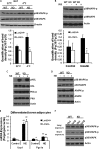
Activation of p38 MAPK signaling in BAT and brown adipocytes. A, cold-induced p38 MAPK phosphorylation in BAT; B, p38 MAPK phosphorylation in WT and _Lcn2_−/− primary differentiated brown adipocytes treated with or without insulin (INS) during the past 24 h. Phosphorylation of PKA and HSL (C) and p38 MAPK and AMPK (D) in brown adipocytes treated with NE for 1 h min in the absence of insulin. E, Ucp1 and Pgc1a gene expression in primary differentiated brown adipocytes treated with NE for 24 h; F, p38 MAPK phosphorylation in brown adipocytes treated with recombinant Lcn2 for 24 h. The data are presented as mean ± S.E. Experiments were repeated on two to four independent sets of mice, yielding similar results. *, p < 0.05; ##, p < 0.01. * indicates comparison between genotypes. ## indicates comparison between treatments.
FIGURE 7.
PPARγ agonist reverses thermodysregulation in Lcn2−/− mice. Body temperature is shown for WT (A) and _Lcn2_−/− (B) mice with or without Rosi treatment (n = 5). C, liver glycogen content in mice with and without Rosi treatment (n = 4–5). D, serum glucose levels; E, lactate levels; F, free fatty acids levels. G, mRNA expression of thermogenic genes Pgc1a and Prdm16 in BAT (n = 4–5). H, mRNA expression of COXiv and Nrf1 in BAT (n = 4–5). The data are presented as mean ± S.E. * or #, p < 0.05; ** or ##, p < 0.01. * indicates comparison between genotypes. # indicates comparison between treatments.
Similar articles
- Lipocalin 2 is a selective modulator of peroxisome proliferator-activated receptor-gamma activation and function in lipid homeostasis and energy expenditure.
Jin D, Guo H, Bu SY, Zhang Y, Hannaford J, Mashek DG, Chen X. Jin D, et al. FASEB J. 2011 Feb;25(2):754-64. doi: 10.1096/fj.10-165175. Epub 2010 Oct 25. FASEB J. 2011. PMID: 20974668 Free PMC article. - Lipocalin 2, a Regulator of Retinoid Homeostasis and Retinoid-mediated Thermogenic Activation in Adipose Tissue.
Guo H, Foncea R, O'Byrne SM, Jiang H, Zhang Y, Deis JA, Blaner WS, Bernlohr DA, Chen X. Guo H, et al. J Biol Chem. 2016 May 20;291(21):11216-29. doi: 10.1074/jbc.M115.711556. Epub 2016 Mar 22. J Biol Chem. 2016. PMID: 27008859 Free PMC article. - GADD45γ regulates the thermogenic capacity of brown adipose tissue.
Gantner ML, Hazen BC, Conkright J, Kralli A. Gantner ML, et al. Proc Natl Acad Sci U S A. 2014 Aug 12;111(32):11870-5. doi: 10.1073/pnas.1406638111. Epub 2014 Jul 28. Proc Natl Acad Sci U S A. 2014. PMID: 25071184 Free PMC article. - Brown fat biology and thermogenesis.
Richard D, Picard F. Richard D, et al. Front Biosci (Landmark Ed). 2011 Jan 1;16(4):1233-60. doi: 10.2741/3786. Front Biosci (Landmark Ed). 2011. PMID: 21196229 Review. - Origins and early development of the concept that brown adipose tissue thermogenesis is linked to energy balance and obesity.
Trayhurn P. Trayhurn P. Biochimie. 2017 Mar;134:62-70. doi: 10.1016/j.biochi.2016.09.007. Epub 2016 Sep 10. Biochimie. 2017. PMID: 27621146 Review.
Cited by
- Lipocalin-2 deficiency may predispose to the progression of spontaneous age-related adiposity in mice.
Meyers K, López M, Ho J, Wills S, Rayalam S, Taval S. Meyers K, et al. Sci Rep. 2020 Sep 3;10(1):14589. doi: 10.1038/s41598-020-71249-7. Sci Rep. 2020. PMID: 32883997 Free PMC article. - Endocrine role of bone in the regulation of energy metabolism.
Zhou R, Guo Q, Xiao Y, Guo Q, Huang Y, Li C, Luo X. Zhou R, et al. Bone Res. 2021 May 20;9(1):25. doi: 10.1038/s41413-021-00142-4. Bone Res. 2021. PMID: 34016950 Free PMC article. Review. - Crosstalk between Lipid Metabolism and Bone Homeostasis: Exploring Intricate Signaling Relationships.
Xiao H, Li W, Qin Y, Lin Z, Qian C, Wu M, Xia Y, Bai J, Geng D. Xiao H, et al. Research (Wash D C). 2024 Aug 20;7:0447. doi: 10.34133/research.0447. eCollection 2024. Research (Wash D C). 2024. PMID: 39165638 Free PMC article. - Development of a New Index Based on Preoperative Serum Lipocalin 2 to Predict Post-LSG Weight Reduction.
Li N, Xu B, Zeng J, Lei S, Gu L, Feng L, Zhu B, Huang Y, Wang L, Su L, Qu S, Cheng X, Bu L. Li N, et al. Obes Surg. 2022 Apr;32(4):1184-1192. doi: 10.1007/s11695-022-05916-1. Epub 2022 Feb 9. Obes Surg. 2022. PMID: 35138515 Free PMC article. - Lipocalin 2 regulates mitochondrial phospholipidome remodeling, dynamics, and function in brown adipose tissue in male mice.
Su H, Guo H, Qiu X, Lin TY, Qin C, Celio G, Yong P, Senders M, Han X, Bernlohr DA, Chen X. Su H, et al. Nat Commun. 2023 Oct 23;14(1):6729. doi: 10.1038/s41467-023-42473-2. Nat Commun. 2023. PMID: 37872178 Free PMC article.
References
- Waki H., Tontonoz P. (2007) Endocrine functions of adipose tissue. Annu. Rev. Pathol. 2, 31–56 - PubMed
- Enerbäck S. (2010) Human brown adipose tissue. Cell Metab. 11, 248–252 - PubMed
- Lidell M. E., Betz M. J., Dahlqvist Leinhard O., Heglind M., Elander L., Slawik M., Mussack T., Nilsson D., Romu T., Nuutila P., Virtanen K. A., Beuschlein F., Persson A., Borga M., Enerbäck S. (2013) Evidence for two types of brown adipose tissue in humans. Nat. Med. 19, 631–634 - PubMed
- Nedergaard J., Bengtsson T., Cannon B. (2007) Unexpected evidence for active brown adipose tissue in adult humans. Am. J. Physiol. Endocrinol. Metab. 293, E444–E452 - PubMed
Publication types
MeSH terms
Substances
Grants and funding
- P30 DK050456/DK/NIDDK NIH HHS/United States
- R01 DK080743/DK/NIDDK NIH HHS/United States
- R01DK080743/DK/NIDDK NIH HHS/United States
- 2P30DK050456/DK/NIDDK NIH HHS/United States
LinkOut - more resources
Full Text Sources
Other Literature Sources
Molecular Biology Databases
Miscellaneous

