Human genetics. The genetics of Mexico recapitulates Native American substructure and affects biomedical traits - PubMed (original) (raw)
. 2014 Jun 13;344(6189):1280-5.
doi: 10.1126/science.1251688. Epub 2014 Jun 12.
Christopher R Gignoux 2, Juan Carlos Fernández-López 3, Fouad Zakharia 4, Martin Sikora 4, Alejandra V Contreras 3, Victor Acuña-Alonzo 5, Karla Sandoval 4, Celeste Eng 6, Sandra Romero-Hidalgo 3, Patricia Ortiz-Tello 4, Victoria Robles 4, Eimear E Kenny 4, Ismael Nuño-Arana 7, Rodrigo Barquera-Lozano 8, Gastón Macín-Pérez 8, Julio Granados-Arriola 9, Scott Huntsman 6, Joshua M Galanter 10, Marc Via 6, Jean G Ford 11, Rocío Chapela 12, William Rodriguez-Cintron 13, Jose R Rodríguez-Santana 14, Isabelle Romieu 15, Juan José Sienra-Monge 16, Blanca del Rio Navarro 16, Stephanie J London 17, Andrés Ruiz-Linares 18, Rodrigo Garcia-Herrera 3, Karol Estrada 3, Alfredo Hidalgo-Miranda 3, Gerardo Jimenez-Sanchez 3, Alessandra Carnevale 3, Xavier Soberón 3, Samuel Canizales-Quinteros 19, Héctor Rangel-Villalobos 7, Irma Silva-Zolezzi 3, Esteban Gonzalez Burchard 20, Carlos D Bustamante 1
Affiliations
- PMID: 24926019
- PMCID: PMC4156478
- DOI: 10.1126/science.1251688
Human genetics. The genetics of Mexico recapitulates Native American substructure and affects biomedical traits
Andrés Moreno-Estrada et al. Science. 2014.
Abstract
Mexico harbors great cultural and ethnic diversity, yet fine-scale patterns of human genome-wide variation from this region remain largely uncharacterized. We studied genomic variation within Mexico from over 1000 individuals representing 20 indigenous and 11 mestizo populations. We found striking genetic stratification among indigenous populations within Mexico at varying degrees of geographic isolation. Some groups were as differentiated as Europeans are from East Asians. Pre-Columbian genetic substructure is recapitulated in the indigenous ancestry of admixed mestizo individuals across the country. Furthermore, two independently phenotyped cohorts of Mexicans and Mexican Americans showed a significant association between subcontinental ancestry and lung function. Thus, accounting for fine-scale ancestry patterns is critical for medical and population genetic studies within Mexico, in Mexican-descent populations, and likely in many other populations worldwide.
Copyright © 2014, American Association for the Advancement of Science.
Figures
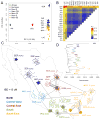
Fig. 1
Genetic differentiation of Native Mexican populations. (A) Principal component analysis of Native Mexicans with HapMap YRI and CEU samples. Population labels as in Table S1. (B) Pairwise FST values among Native Mexican populations ordered geographically (see also Table S4). (C) Relatedness graph of individuals sharing more than 13 cM of the genome as measured by the total of segments identical-by-descent (IBD). Each node represents a haploid genome and edges within clusters attract nodes proportionally to shared IBD. The spread of each cluster is thus indicative of the level of relatedness in each population as determined by a force-directed algorithm. Only the layout of nodes within each cluster is the result of the algorithm, as populations are localized to their approximate sampling locations to ease interpretation. Parentheses indicate the number of individuals represented out of the total sample size (2N). The full range of IBD thresholds are shown in fig. S8. (D) TreeMix graph representing population splitting patterns of the 20 Native Mexican groups studied. The length of the branch is proportional to the drift of each population. African, European, and Asian samples were used as outgroups to root the tree (fig. S9).
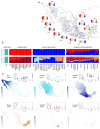
Fig. 2
Mexican population structure. (A) Map of sampled populations (detailed in Table S1) and admixture average proportions (Table S5). Dots correspond to Native Mexican populations color-coded according to K=9 clusters identified in B (bottom), and shaded areas denote states in which cosmopolitan populations were sampled. Pie charts summarize per-state average proportions of cosmopolitan samples at K=3 (European in red, West African in green, and Native American in gray). Bars show the total Native American ancestry decomposed into average proportions of the native subcomponents identified at K=9. (B) Global ancestry proportions at K=3 (top) and K=9 (bottom) estimated with ADMIXTURE including African, European, Native Mexican, and cosmopolitan Mexican samples (Tables S1–S2). From left to right Mexican populations are displayed North-to-South. (C) Interpolation maps showing the spatial distribution of the six native components identified at K=9. Contour intensities are proportional to ADMIXTURE values observed in Native Mexican samples, with crosses indicating sampling locations. Scatter plots with linear fits show ADMIXTURE values observed in cosmopolitan samples versus a distance metric summarizing latitude and longitude (long axis) for the sampled states. From left to right: Yucatan, Campeche, Oaxaca, Veracruz, Guerrero, Tamaulipas, Guanajuato, Zacatecas, Jalisco, Durango, and Sonora. Values are adjusted relative to the total Native American ancestry of each individual (9).
Fig. 3
Sub-continental ancestry of admixed Mexican genomes and biomedical implications. (A) Ancestry-specific PCA (ASPCA) of Native American segments from Mexican cosmopolitan samples (colored circles) together with 20 indigenous Mexican populations (population labels). Samples with >10% of non-native admixture were excluded from the reference panel as well as population outliers such as Seri, Lacandon, and Tojolabal. (B) Zoomed detail of the distribution of the Native American fraction of cosmopolitan samples throughout Mexico. Native ancestral populations were used to define PCA space (prefixed by NAT) but removed from the background to highlight the sub-continental origin of admixed genomes (prefixed by MEX). Each circle represents the combined set of haplotypes called as Native American along the haploid genome of each sample with >25% of Native American ancestry. Inset map shows the geographic origin of cosmopolitan samples per state color-coded by region (9). (C) Coefficients and 95% confidence intervals for associations between ASPC1 and lung function (FEV1) from Mexican participants of the Genetics of Asthma in Latino Americans (GALA I) study, and the Mexico City Childhood Asthma Study (MCCAS), as well as both studies combined (Table S6, Fig. S17) (9). (D) Means and confidence intervals of predicted change in FEV1 by state extrapolated from the model in 3C.
Comment in
- MEXICAN HUMAN LEUKOCYTE ANTIGEN ALLELES MIGHT PREDICT CLINICAL OUTCOME IN SARS-COV-2 INFECTED PATIENTS.
Garcia-Silva R, Hernandez-Dono S, Mena L, Granados J. Garcia-Silva R, et al. Rev Invest Clin. 2020;72(3):178-179. doi: 10.24875/RIC.20000135. Rev Invest Clin. 2020. PMID: 32584323 No abstract available.
Similar articles
- Native American admixture recapitulates population-specific migration and settlement of the continental United States.
Jordan IK, Rishishwar L, Conley AB. Jordan IK, et al. PLoS Genet. 2019 Sep 23;15(9):e1008225. doi: 10.1371/journal.pgen.1008225. eCollection 2019 Sep. PLoS Genet. 2019. PMID: 31545791 Free PMC article. - Reconstructing Native American migrations from whole-genome and whole-exome data.
Gravel S, Zakharia F, Moreno-Estrada A, Byrnes JK, Muzzio M, Rodriguez-Flores JL, Kenny EE, Gignoux CR, Maples BK, Guiblet W, Dutil J, Via M, Sandoval K, Bedoya G; 1000 Genomes Project; Oleksyk TK, Ruiz-Linares A, Burchard EG, Martinez-Cruzado JC, Bustamante CD. Gravel S, et al. PLoS Genet. 2013;9(12):e1004023. doi: 10.1371/journal.pgen.1004023. Epub 2013 Dec 26. PLoS Genet. 2013. PMID: 24385924 Free PMC article. - Genetic admixture, relatedness, and structure patterns among Mexican populations revealed by the Y-chromosome.
Rangel-Villalobos H, Muñoz-Valle JF, González-Martín A, Gorostiza A, Magaña MT, Páez-Riberos LA. Rangel-Villalobos H, et al. Am J Phys Anthropol. 2008 Apr;135(4):448-61. doi: 10.1002/ajpa.20765. Am J Phys Anthropol. 2008. PMID: 18161845 - Genetic analysis of 17 Y-STRs in a Mestizo population from the Central Valley of Mexico.
Santana C, Noris G, Meraz-Ríos MA, Magaña JJ, Calderon-Aranda ES, Muñoz Mde L, Gómez R. Santana C, et al. Hum Biol. 2014 Fall;86(4):289-312. doi: 10.13110/humanbiology.86.4.0289. Hum Biol. 2014. PMID: 25959695 Review. - Genetic, metabolic and environmental factors involved in the development of liver cirrhosis in Mexico.
Ramos-Lopez O, Martinez-Lopez E, Roman S, Fierro NA, Panduro A. Ramos-Lopez O, et al. World J Gastroenterol. 2015 Nov 7;21(41):11552-66. doi: 10.3748/wjg.v21.i41.11552. World J Gastroenterol. 2015. PMID: 26556986 Free PMC article. Review.
Cited by
- Selective Effect of DNA N6-Methyladenosine Modification on Transcriptional Genetic Variations in East Asian Samples.
Luan M, Chen K, Zhao W, Tang M, Wang L, Liu S, Zhu L, Xie S. Luan M, et al. Int J Mol Sci. 2024 Sep 27;25(19):10400. doi: 10.3390/ijms251910400. Int J Mol Sci. 2024. PMID: 39408729 Free PMC article. - Genetic associations with disease in populations with Indigenous American ancestries.
Vicuña L. Vicuña L. Genet Mol Biol. 2024 Sep 9;47Suppl 1(Suppl 1):e20230024. doi: 10.1590/1678-4685-GMB-2023-0024. eCollection 2024. Genet Mol Biol. 2024. PMID: 39254840 Free PMC article. - Selection scan in Native Americans of Mexico identifies FADS2 rs174616: Evidence of gene-diet interactions affecting lipid levels and Delta-6-desaturase activity.
Romero-Hidalgo S, Sagaceta-Mejía J, Villalobos-Comparán M, Tejero ME, Domínguez-Pérez M, Jacobo-Albavera L, Posadas-Sánchez R, Vargas-Alarcón G, Posadas-Romero C, Macías-Kauffer L, Vadillo-Ortega F, Contreras-Sieck MA, Acuña-Alonzo V, Barquera R, Macín G, Binia A, Guevara-Chávez JG, Sebastián-Medina L, Menjívar M, Canizales-Quinteros S, Carnevale A, Villarreal-Molina T. Romero-Hidalgo S, et al. Heliyon. 2024 Jul 30;10(15):e35477. doi: 10.1016/j.heliyon.2024.e35477. eCollection 2024 Aug 15. Heliyon. 2024. PMID: 39166092 Free PMC article. - Spatiotemporal fluctuations of population structure in the Americas revealed by a meta-analysis of the first decade of archaeogenomes.
Dos Santos ALC, Sullasi HSL, Gokcumen O, Lindo J, DeGiorgio M. Dos Santos ALC, et al. Am J Biol Anthropol. 2023 Apr;180(4):703-714. doi: 10.1002/ajpa.24673. Epub 2022 Dec 4. Am J Biol Anthropol. 2023. PMID: 39081397 Free PMC article. - Development and Application of Genetic Ancestry Reconstruction Methods to Study Diversity of Patient-Derived Models in the NCI PDXNet Consortium.
Lott PC, Chiu K, Quino JE, Vang AP, Lloyd MW, Srivastava A, Chuang JH; PDXNet Consortium; Carvajal-Carmona LG. Lott PC, et al. Cancer Res Commun. 2024 Aug 1;4(8):2147-2152. doi: 10.1158/2767-9764.CRC-23-0417. Cancer Res Commun. 2024. PMID: 39056190 Free PMC article.
References
- Lisker R, Ramirez E, Babinsky V. Genetic structure of autochthonous populations of Meso-America: Mexico. Hum Biol. 1996 Jun;68:395. - PubMed
Publication types
MeSH terms
Grants and funding
- R13 MD008154/MD/NIMHD NIH HHS/United States
- K23 HL004464/HL/NHLBI NIH HHS/United States
- ZIA ES49019/ES/NIEHS NIH HHS/United States
- ES015794/ES/NIEHS NIH HHS/United States
- R01GM090087/GM/NIGMS NIH HHS/United States
- HL078885/HL/NHLBI NIH HHS/United States
- HL004464/HL/NHLBI NIH HHS/United States
- P60MD006902/MD/NIMHD NIH HHS/United States
- RR000083/RR/NCRR NIH HHS/United States
- P60 MD006902/MD/NIMHD NIH HHS/United States
- ZIA ES049019-14/ImNIH/Intramural NIH HHS/United States
- HL088133/HL/NHLBI NIH HHS/United States
- R01HG003229/HG/NHGRI NIH HHS/United States
- R01 ES015794/ES/NIEHS NIH HHS/United States
- R01 HG003229/HG/NHGRI NIH HHS/United States
- T32HG000044/HG/NHGRI NIH HHS/United States
- R01 HL078885/HL/NHLBI NIH HHS/United States
- R01 GM083606/GM/NIGMS NIH HHS/United States
- R01 GM090087/GM/NIGMS NIH HHS/United States
- T32GM007175/GM/NIGMS NIH HHS/United States
- T32 GM007546/GM/NIGMS NIH HHS/United States
- U01 GM061390/GM/NIGMS NIH HHS/United States
- ZIA ES049019-15/ImNIH/Intramural NIH HHS/United States
- T32 HG000044/HG/NHGRI NIH HHS/United States
- U19 GM061390/GM/NIGMS NIH HHS/United States
- GM007546/GM/NIGMS NIH HHS/United States
- GM061390/GM/NIGMS NIH HHS/United States
- 001/WHO_/World Health Organization/International
- M01 RR000083/RR/NCRR NIH HHS/United States
- R01 HL088133/HL/NHLBI NIH HHS/United States
- HL111636/HL/NHLBI NIH HHS/United States
- T32 GM007175/GM/NIGMS NIH HHS/United States
- K23 HL111636/HL/NHLBI NIH HHS/United States
- Z01 ES049019/ImNIH/Intramural NIH HHS/United States
- BB/I021213/1/BB_/Biotechnology and Biological Sciences Research Council/United Kingdom
LinkOut - more resources
Full Text Sources
Other Literature Sources


