Modulation of gut microbiota during probiotic-mediated attenuation of metabolic syndrome in high fat diet-fed mice - PubMed (original) (raw)
Modulation of gut microbiota during probiotic-mediated attenuation of metabolic syndrome in high fat diet-fed mice
Jingjing Wang et al. ISME J. 2015 Jan.
Abstract
Structural disruption of gut microbiota and associated inflammation are considered important etiological factors in high fat diet (HFD)-induced metabolic syndrome (MS). Three candidate probiotic strains, Lactobacillus paracasei CNCM I-4270 (LC), L. rhamnosus I-3690 (LR) and Bifidobacterium animalis subsp. lactis I-2494 (BA), were individually administered to HFD-fed mice (10(8) cells day(-1)) for 12 weeks. Each strain attenuated weight gain and macrophage infiltration into epididymal adipose tissue and markedly improved glucose-insulin homeostasis and hepatic steatosis. Weighted UniFrac principal coordinate analysis based on 454 pyrosequencing of fecal bacterial 16S rRNA genes showed that the probiotic strains shifted the overall structure of the HFD-disrupted gut microbiota toward that of lean mice fed a normal (chow) diet. Redundancy analysis revealed that abundances of 83 operational taxonomic units (OTUs) were altered by probiotics. Forty-nine altered OTUs were significantly correlated with one or more host MS parameters and were designated 'functionally relevant phylotypes'. Thirteen of the 15 functionally relevant OTUs that were negatively correlated with MS phenotypes were promoted, and 26 of the 34 functionally relevant OTUs that were positively correlated with MS were reduced by at least one of the probiotics, but each strain changed a distinct set of functionally relevant OTUs. LC and LR increased cecal acetate but did not affect circulating lipopolysaccharide-binding protein; in contrast, BA did not increase acetate but significantly decreased adipose and hepatic tumor necrosis factor-α gene expression. These results suggest that Lactobacillus and Bifidobacterium differentially attenuate obesity comorbidities in part through strain-specific impacts on MS-associated phylotypes of gut microbiota in mice.
Figures
Figure 1
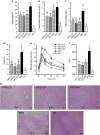
Probiotics attenuated HFD-induced obesity, impaired glucose–insulin homeostasis and hepatic steatosis. (a) Body weight gain as the percentage of baseline weight for each mouse. (b) Fasting blood glucose. (c) Fasting insulin. (d) HOMA-IR, calculated by fasting blood glucose (mmol l−1) × fasting insulin (mU l−1)/22.5. (e) Curve of OGTT. (f) Areas under the curve (AUC) of OGTT. (g) Hematoxylin and eosin-stained liver sections, with the average steatosis ‘rank' for each treatment (lowest=1, highest=6) indicated by numbers. Data are shown as means±s.e.m. Values of each group with same letters are not significantly different by analysis of variance followed by Tukey post hoc test. #_P_=0.055, $_P_=0.086, &_P_=0.070 vs HFD group. _n_=8 mice per group.
Figure 2
Probiotics mitigated macrophage infiltration in eAT, and BA significantly decreased adipose and hepatic TNF-α gene expression. (a) Mean cell area of adipocyte in eAT (_n_=8 mice per group). (b) CLS, bar=200 μm; CLS were counted in three sections (⩾600 adipocytes) per mouse (_n_=5 mice per group); data are expressed as ‘percent CLS' for analysis, data were transformed as ‘arcsin √x'. (c) Quantitation of MMP-12-positive cells in fixed sections of eAT, and data were derived from five ( × 400) microscopic fields from each of 8 mice per diet cohort. (d–g) Gene expression levels of CD11c (d), TNF-α (e), monocyte chemotactic protein-1 (f) and adiponectin (g) in eAT (_n_=8 mice per group). (h–i) Gene expression levels of TNF-α in the liver (h) and jejunum (i) (_n_=8 mice per group). All mRNA quantification data were normalized to the housekeeping gene GAPDH. Gene expression levels were expressed as values relative to the NC group. (j) Serum LBP (_n_=8 mice per group). (k) Serum adiponectin corrected for body weight (_n_=8 mice per group). Data are shown as means±s.e.m. Values of each group with same letters are not significantly different by analysis of variance followed by Tukey post hoc test. #_P_=0.078, $_P_=0.059 vs HFD group.
Figure 3
Probiotics changed overall structure of gut microbiota. (a) Weighted UniFrac PCoA plot based on OTU abundance. Each point represents the fecal microbiota of a mouse. One mouse from group HFD+LR was detected as an outlier owing to the predominance of OTUs belonging to Erysipelotrichaceae (50.6% of the total bacteria, data not shown) and was thus excluded from the analysis. (b) Clustering of gut microbiota based on mahalanobis distances between different groups calculated with multivariate analysis of variance test, **P<0.01.
Figure 4
Eighty-three OTUs that were changed in abundance by probiotics according to redundancy analysis (RDA). (a) Heatmap of the abundance of 83 OTUs. Rows correspond to 48 OTUs enriched and 35 OTUs reduced. (b) The changing direction of the 83 OTUs by probiotics according to RDA. Circles and dots indicate the abundance of OTUs that were more and less abundant, respectively, in probiotics groups and NC group relative to HFD group. The taxonomy of the OTUs (genus, family and phylum) is depicted on the right. Asterisk (*) represents the OTU whose abundance was changed by HFD and then the change was reversed by probiotics.
Figure 5
Forty-nine probiotic-altered OTUs that were significantly correlated with host MS parameters. (a) The changing direction of the 49 OTUs. Circles and dots indicate the OTUs that were more and less abundant, respectively, in the probiotics groups and NC group relative to the HFD group. Asterisk (*) represents OTU whose abundance was changed by HFD and then the change was reversed by probiotics. (b) The correlation between 49 OTUs and host MS parameters. Rows correspond to OTUs with the IDs shown on the left, and columns correspond to MS parameters related to obesity, glucose–insulin homeostasis and inflammation. Colors red and blue denote positive and negative association, respectively. The intensity of the colors represents the degree of association between the OTU abundances and host parameters as assessed by the Spearman's correlations. The black dots in the blue/red cells indicate that the associations were significant (false discovery rate<0.25). The taxonomy of the OTUs is shown on the right. (c) Venn diagrams of 49 OTUs. The OTUs' taxonomy is listed, and blue and red mean that the OTU was negatively and positively, respectively, correlated with MS parameters. ↑ means increased by probiotics, and ↓ represents decreased by probiotics.
Figure 6
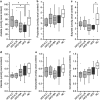
Probiotics LC and LR elevated the concentrations of acetate in cecal content. (a–f) Levels of acetate (a), propionate (b), butyrate (c), valerate (d), isobutyrate (e) and isovalerate (f). In the box plot, the bottom and top are, respectively, the 25th and 75th percentile, a line within the box marks the median and a circle in the box shows the mean. Whiskers above and below the box indicate 1.5 interquartile range of the lower and upper quartile, respectively, and samples beyond are regarded as outliers. *P<0.05 by Mann–Whitney test.
Similar articles
- Bifidobacterium adolescentis Isolated from Different Hosts Modifies the Intestinal Microbiota and Displays Differential Metabolic and Immunomodulatory Properties in Mice Fed a High-Fat Diet.
Wang B, Kong Q, Cui S, Li X, Gu Z, Zhao J, Zhang H, Chen W, Wang G. Wang B, et al. Nutrients. 2021 Mar 21;13(3):1017. doi: 10.3390/nu13031017. Nutrients. 2021. PMID: 33801119 Free PMC article. - In vivo screening of multiple bacterial strains identifies Lactobacillus rhamnosus Lb102 and Bifidobacterium animalis ssp. lactis Bf141 as probiotics that improve metabolic disorders in a mouse model of obesity.
Le Barz M, Daniel N, Varin TV, Naimi S, Demers-Mathieu V, Pilon G, Audy J, Laurin É, Roy D, Urdaci MC, St-Gelais D, Fliss I, Marette A. Le Barz M, et al. FASEB J. 2019 Apr;33(4):4921-4935. doi: 10.1096/fj.201801672R. Epub 2018 Dec 31. FASEB J. 2019. PMID: 30596521 - Modulation of gut microbiota contributes to curcumin-mediated attenuation of hepatic steatosis in rats.
Feng W, Wang H, Zhang P, Gao C, Tao J, Ge Z, Zhu D, Bi Y. Feng W, et al. Biochim Biophys Acta Gen Subj. 2017 Jul;1861(7):1801-1812. doi: 10.1016/j.bbagen.2017.03.017. Epub 2017 Mar 21. Biochim Biophys Acta Gen Subj. 2017. PMID: 28341485 - Gut Colonization Mechanisms of Lactobacillus and Bifidobacterium: An Argument for Personalized Designs.
Xiao Y, Zhai Q, Zhang H, Chen W, Hill C. Xiao Y, et al. Annu Rev Food Sci Technol. 2021 Mar 25;12:213-233. doi: 10.1146/annurev-food-061120-014739. Epub 2020 Dec 14. Annu Rev Food Sci Technol. 2021. PMID: 33317320 Review. - The health effect of probiotics on high-fat diet-induced cognitive impairment, depression and anxiety: A cross-species systematic review.
Lof J, Smits K, Melotte V, Kuil LE. Lof J, et al. Neurosci Biobehav Rev. 2022 May;136:104634. doi: 10.1016/j.neubiorev.2022.104634. Epub 2022 Mar 23. Neurosci Biobehav Rev. 2022. PMID: 35339484 Review.
Cited by
- Ganoderma lucidum reduces obesity in mice by modulating the composition of the gut microbiota.
Chang CJ, Lin CS, Lu CC, Martel J, Ko YF, Ojcius DM, Tseng SF, Wu TR, Chen YY, Young JD, Lai HC. Chang CJ, et al. Nat Commun. 2015 Jun 23;6:7489. doi: 10.1038/ncomms8489. Nat Commun. 2015. PMID: 26102296 Free PMC article. - The Synergistic Activity of Rhamnolipid Combined with Linezolid against Linezolid-Resistant Enterococcus faecium.
Chang Q, Chen H, Li Y, Li H, Yang Z, Zeng J, Zhang P, Ge J, Gao M. Chang Q, et al. Molecules. 2023 Nov 16;28(22):7630. doi: 10.3390/molecules28227630. Molecules. 2023. PMID: 38005351 Free PMC article. - Review: Diversity of Microorganisms in Global Fermented Foods and Beverages.
Tamang JP, Watanabe K, Holzapfel WH. Tamang JP, et al. Front Microbiol. 2016 Mar 24;7:377. doi: 10.3389/fmicb.2016.00377. eCollection 2016. Front Microbiol. 2016. PMID: 27047484 Free PMC article. Review. - The Influence of Diet and Sex on the Gut Microbiota of Lean and Obese JCR:LA-cp Rats.
Resch C, Parikh M, Austria JA, Proctor SD, Netticadan T, Blewett H, Pierce GN. Resch C, et al. Microorganisms. 2021 May 12;9(5):1037. doi: 10.3390/microorganisms9051037. Microorganisms. 2021. PMID: 34066029 Free PMC article. - Relationship between Changes in Microbiota and Liver Steatosis Induced by High-Fat Feeding-A Review of Rodent Models.
Gómez-Zorita S, Aguirre L, Milton-Laskibar I, Fernández-Quintela A, Trepiana J, Kajarabille N, Mosqueda-Solís A, González M, Portillo MP. Gómez-Zorita S, et al. Nutrients. 2019 Sep 9;11(9):2156. doi: 10.3390/nu11092156. Nutrients. 2019. PMID: 31505802 Free PMC article. Review.
References
- Aguirre V, Werner ED, Giraud J, Lee YH, Shoelson SE, White MF. Phosphorylation of Ser307 in insulin receptor substrate-1 blocks interactions with the insulin receptor and inhibits insulin action. J Biol Chem. 2002;277:1531–1537. - PubMed
- Araya MML, Reid G, Sanders ME, Stanton C. Guidelines for the Evaluation of Probiotics in Food. Jt. FAO/WHO Work. Group: London, UK; Ontario, Canada; 2002.
Publication types
MeSH terms
LinkOut - more resources
Full Text Sources
Other Literature Sources
Medical


