Phosphorylation of nucleoporin Tpr governs its differential localization and is required for its mitotic function - PubMed (original) (raw)
. 2014 Aug 15;127(Pt 16):3505-20.
doi: 10.1242/jcs.149112. Epub 2014 Jun 17.
Affiliations
- PMID: 24938596
- PMCID: PMC4141044
- DOI: 10.1242/jcs.149112
Phosphorylation of nucleoporin Tpr governs its differential localization and is required for its mitotic function
Kalpana Rajanala et al. J Cell Sci. 2014.
Erratum in
- Correction: Phosphorylation of nucleoporin Tpr governs its differential localization and is required for its mitotic function.
Rajanala K, Sarkar A, Jhingan GD, Priyadarshini R, Jalan M, Sengupta S, Nandicoori VK. Rajanala K, et al. J Cell Sci. 2022 Mar 15;135(6):jcs260004. doi: 10.1242/jcs.260004. Epub 2022 Mar 28. J Cell Sci. 2022. PMID: 35344051 Free PMC article. No abstract available.
Abstract
A major constituent of the nuclear basket region of the nuclear pore complex (NPC), nucleoporin Tpr, plays roles in regulating multiple important processes. We have previously established that Tpr is phosphorylated in both a MAP-kinase-dependent and MAP-kinase-independent manner, and that Tpr acts as both a substrate and as a scaffold for ERK2 (also known as MAPK1). Here, we report the identification of S2059 and S2094 as the major novel ERK-independent phosphorylation sites and T1677, S2020, S2023 and S2034 as additional ERK-independent phosphorylation sites found in the Tpr protein in vivo. Our results suggest that protein kinase A phosphorylates the S2094 residue and that the site is hyperphosphorylated during mitosis. Furthermore, we find that Tpr is phosphorylated at the S2059 residue by CDK1 and the phosphorylated form distinctly localizes with chromatin during telophase. Abrogation of S2059 phosphorylation abolishes the interaction of Tpr with Mad1, thus compromising the localization of both Mad1 and Mad2 proteins, resulting in cell cycle defects. The identification of novel phosphorylation sites on Tpr and the observations presented in this study allow better understanding of Tpr functions.
Keywords: Localization; Mitosis; Nucleoporin Tpr; Phosphorylation.
© 2014. Published by The Company of Biologists Ltd.
Figures
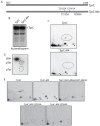
Fig. 1.
Nucleoporin Tpr is phosphorylated in vivo at residues S2059 and S2094. (A) Schematic representation of the TprC and TprC-M4 constructs. (B) COS-1 cells transfected with constructs encoding FLAG–TprC or FLAG–TprC-M4 were metabolically labeled, and FLAG-tagged proteins were immunoprecipitated, resolved and autoradiographed. (C) _In-vivo_-labeled TprC and TprC-M4 were digested with trypsin, and the resulting phosphopeptides were mapped by 2D thin-layer chromatography (TLC). Arrows indicate the labeled phosphopeptides that were persistent in the in vivo map of TprC-M4. Dotted circles indicate ERK2-mediated phosphorylation, which is lost from TprC-M4. (D) Phospho-amino-acid analysis of the labeled TprC-M4 protein. The dotted circles show the migration of phosphorylated threonine (pThr) and phosphorylated tyrosine (pTyr) amino acid standards detected by ninhydrin staining. (E) Metabolically labeled TprC-M4-(S2046,2047,2049A), TprC-M4-(S2059A) and TprC-M4-(S2094A) proteins were digested with trypsin and were mapped by 2D-TLC. White arrows and dotted circles indicate the disappearance of labeled phosphopeptide spots that are indicated with black arrows for TrpC-M4.
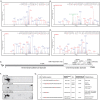
Fig. 2.
Identification of phosphorylation sites by mass spectrometry. (A–D) LC-MS/MS data showing electron transfer dissociation (ETD)-induced fragmentation mass spectra identifying four phosphopeptides in Tpr. pT and pS indicates the site of phosphorylation. (A) MS/MS spectrum of precursor m/z 815.74695 (+3) and MH+ 2445.22629 Da, of the semi-tryptic phosphopeptide GIASTSDPPTANIKPTPVVS(pT)PSK. The unambiguous location of the intact phosphate group on T1677 was determined by the presence of the ‘C’ and ‘Z’ ion series containing C22, C23 and Z4–7, Z9, Z12–15, Z18 and Z20–22. (B) MS/MS spectrum of precursor m/z 882.67010 (+3) and MH+ 2645.99576 Da, of the phosphopeptide AAD(pS)QN (pS)GEGNTGAAESSFSQEVSR. The location of the intact phosphate groups was confirmed by the observation of the ‘C’ and ‘Z’ ion series containing C4, C6–11, C13–19, C24 and Z19 and Z21–23. (C) MS/MS spectrum of precursor m/z 856.01892 (+3) and MH+ 2566.04221 Da, of phosphopeptide AADSQNSGEGNTGAAES(pS)FSQEVSR. The location of S2034 was evident by the observation of the ion series containing C18–22, C24 and Z8–12 and Z14–23. (D) MS/MS spectrum of precursor m/z 781.86627 (+4) and MH+ 3124.44326 Da, of semi-tryptic phosphopeptide RQ(pS)VGRGLQLTPGIGGMQQHFFDDEDR. The presence of a phosphate group at S2094 is confirmed by the appearance of the ion series containing C3–5, C7, C9–10, C14–15, C17–26 and Z25–26. (E) A schematic outline indicating all the phosphorylation sites on Tpr. The S1185 residue was identified to be a target for PLK1 (Santamaria et al., 2011) (F) FLAG-tagged wild-type and mutant TprC-M4 proteins were resolved on 13-cm pH 3.5–5.6 non-linear gradient IPG strips for 25,000 Vh. IPG strips were resolved in the second dimension by SDS-PAGE on 10% gels, transferred to nitrocellulose membrane and subjected to western blotting with mouse anti-FLAG antibodies. The arrows show the spot corresponding to Tpr phosphorylated at S2059; the dotted circle shows the disappearance of this spot in the phospho-mutant TprC-M4-S2059A. (G) Compilation of all the data for the identified sites. The stoichiometry of phosphorylation for sites identified by mass spectrometry were determined as described in Materials and Methods. To determine the stoichiometry of phosphorylated S2059 species, we used ImageJ quantification (Schneider et al., 2012) of the 2D gels presented in F. Probable kinase prediction was performed using Scansite software and the search was performed at low stringency (Obenauer et al., 2003). Phosphorylated amino acids are shown in red.
Fig. 3.
Characterization of phosphospecific antibodies of Tpr. (A,B) COS-1 cells were transfected with 2 µg each of pCDNA3-FLAG construct or constructs encoding FLAG–TprC, FLAG–TprC-S2059A or FLAG–TprC-S2094A. The lysates obtained at 36 h after transfection were loaded alongside the purified bacterial TprC protein. The samples were resolved and transferred onto nitrocellulose membrane, and the blot was probed with anti-FLAG, anti-ERK, rabbit polyclonal anti-Tpr (Frosst et al., 2002) anti-Tpr-pS2059 and anti-Tpr-pS2059 antibodies. (C,D) COS-1 cells were transfected with 2 µg each of pCDNA3-FLAG construct or constructs encoding FLAG–Tpr-Si, FLAG–Tpr-Si-S2059A or FLAG–Tpr-Si-S2094A. The lysates were then analyzed with anti-FLAG, anti-ERK, anti-Tpr-pS2059 and anti-Tpr-pS2059 antibodies. (E) Immunofluorescence analysis of HeLa cells stained with anti-Tpr (red), anti-Tpr-pS2059 (green) and anti-Tpr-pS2094 (green) antibodies. Arrowheads show the nucleolar localization of Tpr-pS2094. Scale bars: 10 µm (left panels), 20 µm (right panels). (F) HeLa cells were transfected with non-specific siRNA (NS-siRNA) or Tpr-specific siRNA (Tpr-siRNA). At 48 h post-transfection, the cell lysates were probed with mouse monoclonal anti-Tpr (Abcam), anti-β-actin, anti-Tpr-pS2059 and anti-Tpr-pS2094 antibodies. (G) Immunofluorescence analysis of HeLa cells transfected with Tpr-specific siRNA and stained with anti-Tpr-pS2059 (green) or anti-Tpr-pS2094 (green) and anti-Tpr (red) antibodies. Scale bars: 10 µm.
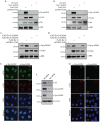
Fig. 4.
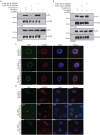
PKA and CDK1 phosphorylate Tpr at residues S2094 and S2059, respectively. (A) COS-1 cells were transfected with 8 µg each of constructs encoding wild-type FLAG–TprC, FLAG–TprC-S2059A, FLAG–TprC-S2094A, HA–ERK2 and CMV-PKA. The lysates of cell obtained at 36 h post-transfection were immunoprecipitated with anti-FLAG, anti-HA or anti-PKA antibodies. The immunoprecipitated FLAG–TprC or CMV-PKA were mixed either with immunoprecipitated HA–ERK2 or with FLAG–TprC, FLAG–TprC-S2059A or FLAG–TprC-S2094A samples, respectively, and kinase reactions were performed in the presence of [γ-32P]-ATP at 30°C for 10 min. (B) TprC phosphorylated in vitro by either ERK2 or PKA was digested with trypsin, and the resulting phosphopeptides were mapped by 2D-TLC. A comparative peptide map of the _in_-_vivo_-labeled TprC protein is also shown. Arrowheads show the ERK-independent tryptic phosphopeptides; dotted circles show ERK-mediated phosphorylation. (C) COS-1 cells were transfected with either NS-siRNA (NS-Si) or PKA-specific siRNA (PKA-Si) and, 96 h post-transfection, cell lysates were probed with anti-PKA, anti-β-actin, anti-CREB-pS133, anti-Tpr and anti-Tpr-pS2094 antibodies. (D) HeLa cells were treated with inhibitors against GSK3β (Inhibitor VIII; 10 µM), PLK (BI2536; 100 nM), p38 (SB203580; 20 µM), Aurora kinase (MLN8237; 500 nM) and CDK1 (RO3306; 10 µM) for 2 h. Cells were lysed in 2× SDS sample buffer and the lysates were then probed with anti-Tpr, anti-Tpr-pS2059 and anti-β-actin antibodies. (E) Wild-type His–TprC and the phospho-mutants His–TprC-S2059A and His–TprC-S2094A were purified from E.coli. The proteins were incubated with CDK1–cyclinB complex and kinase reactions were carried out in the presence of [γ-32P]-ATP at 30°C for 10 min. The autoradiogram is shown, along with Coomassie Blue staining to visualize protein loading.
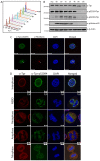
Fig. 5.
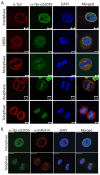
Localization of S2094-phosphorylated Tpr during cell cycle. (A) HeLa cells were arrested at a pre-mitotic stage by treatment with 40 ng/ml nocodazole and were subsequently released by washing off the drug. Samples were stained with propidium iodide and analyzed by flow cytometry to check for the synchronization of cells after release from the nocodazole block. (B) Western blot analysis of the lysates obtained from cells harvested at different time-points after release from the nocodazole block and probed with anti-Tpr, anti-β-actin, anti-phosphorylated-histone3, anti-Tpr-pS2059 and anti-Tpr-pS2094 antibodies. (C) Immunofluorescence analysis of HeLa cells stained with anti-Tpr-pS2094 (green) and anti-fibrillarin (red) antibodies. Arrowheads indicate the nucleolar staining. Scale bars: 10 µm. (D) Immunofluorescence analysis of an asynchronous HeLa cell population stained with DAPI (DNA, blue) and anti-Tpr (red) and anti-Tpr-pS2094 (green) antibodies. Images of the cells captured at different stages of mitosis are shown. NEBD, nuclear envelope breakdown. Scale bars: 5 µm.
Fig. 6.
S2059-phosphorylated Tpr localizes to chromatin at the end of mitosis. (A) Immunofluorescence analysis of an asynchronous HeLa cell population stained with DAPI (DNA, blue) and anti-Tpr-pS2059 (green) and anti-Tpr (red) antibodies. Images of the cells at different mitotic stages are shown. NEBD, nuclear envelope breakdown. Scale bars: 5 µm. (B) Asynchronous HeLa cells were stained with anti-Tpr-pS2059 (green) and mAB414 (red) antibodies. Cells imaged at interphase and telophase are shown. Scale bars: 10 µm.
Fig. 7.
Phosphorylation at S2059 is required for the interaction of Tpr with Mad1 and the correct localization of Mad proteins. (A) COS-1 cells were transfected with pCDNA3-FLAG construct or constructs encoding FLAG–Tpr-Si, FLAG–Tpr-Si-S2059A, FLAG–Tpr-Si-S2094A or HA–Mad1. At 36 h post-transfection, cells were lysed, and the lysates were immunoprecipitated (IP) with anti-FLAG antibodies. The immunoblots were probed with anti-FLAG and anti-HA antibodies to check for the presence of the interacting HA–Mad1 protein. (B) COS-1 cells were transfected with pCDNA3-FLAG construct or constructs encoding FLAG–Tpr-Si, FLAG–Tpr-Si-S2059A, FLAG–Tpr-Si-S2094A or HA–Mad2. At 36 h post-transfection, the lysates were immunoprecipitated with anti-FLAG antibodies. Western blot analysis was performed using anti-FLAG and anti-HA antibodies to check for the presence of interacting Mad2 protein. (C) HeLa cells were co-transfected with Tpr-specific siRNA along with GFP–Tpr-Si or GFP–Tpr-Si-S2059A or GFP–Tpr-Si-S2094A constructs. The next day, the cells were replated and, 24 h later, the cells were re-transfected with Tpr-specific siRNA and the same constructs. At 96 h after the first transfection, cells were stained with anti-Mad1 antibodies (red) and analyzed by confocal microscopy. Scale bars: 10 µm. (D) HeLa cells were co-transfected with Tpr-specific siRNA along with GFP–Tpr-Si, GFP–Tpr-Si-S2059A or GFP–Tpr-Si-S2094A constructs. At 48 h post-transfection, cells were stained with anti-Mad2 antibodies (red) and analyzed by confocal microscopy. Arrowheads indicate cells transfected with GFP constructs. Scale bars: 10 µm.
Fig. 8.
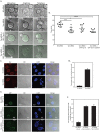
Tpr-depleted cells rescued with phospho-mutants display cell cycle defects. (A) Live-cell analysis of HeLa cells transfected with NS-siRNA or Tpr-specific siRNA, and cells that were rescued with either GFP–Tpr-Si or GFP–Tpr-Si-S2059A constructs. Representative images of cells at metaphase, anaphase and telophase are shown. Scale bars: 20 µm. (B) Analysis of the mitotic timing measured from metaphase until the end of anaphase. Data was obtained from two independent experiments in which cells were treated with control siRNA (40±4.15 min; n = 9), depleted of Tpr (29.5±5.45 min; n = 9) or depleted of Tpr followed by rescue with either GFP–Tpr-Si (33.91±6.6 min; n = 8) or GFP–Tpr-Si-S2059A (27.72±3.29 min; n = 8). Data show the mean±s.d.; *P = 0.0413; ***P = 0.0003; ****P<0.0001. (C) HeLa cells transfected with NS-siRNA or Tpr-specific siRNA were replated the next day and, 24 h later, the cells were again transfected with the same siRNA oligos. After ∼96 h of Tpr depletion, the cells were stained with anti-Tpr antibodies (red) to visualize the presence of nuclear defects resulting from Tpr knockdown. DIC, differential interference contrast. (D) Quantification of the percentage of HeLa cells (n = 50) containing micronuclei after ∼96 hours of Tpr depletion. Data show the mean±s.d. (two independent experiments). (E) HeLa cells were transfected with Tpr-specific siRNA along with constructs encoding GFP–Tpr-Si, GFP–Tpr-Si-S2059A or GFP–Tpr-Si-S2094A. Immunofluorescence analysis was performed at ∼96 h after the first transfection. Arrowheads indicate the presence of micronuclei. Scale bars: 10 µm. (F) Quantification of the percentage of HeLa cells containing micronuclei after ∼96 h of Tpr depletion and following rescue with GFP–Tpr-Si, GFP–Tpr-Si-S2059A or GFP–Tpr-Si-S2094A. Data show the mean±s.d. (n = 50, two independent experiments).
Similar articles
- Extracellular signal-regulated kinase 2 (ERK2) phosphorylation sites and docking domain on the nuclear pore complex protein Tpr cooperatively regulate ERK2-Tpr interaction.
Vomastek T, Iwanicki MP, Burack WR, Tiwari D, Kumar D, Parsons JT, Weber MJ, Nandicoori VK. Vomastek T, et al. Mol Cell Biol. 2008 Nov;28(22):6954-66. doi: 10.1128/MCB.00925-08. Epub 2008 Sep 15. Mol Cell Biol. 2008. PMID: 18794356 Free PMC article. - Therapeutic potential of mitotic interaction between the nucleoporin Tpr and aurora kinase A.
Kobayashi A, Hashizume C, Dowaki T, Wong RW. Kobayashi A, et al. Cell Cycle. 2015;14(9):1447-58. doi: 10.1080/15384101.2015.1021518. Cell Cycle. 2015. PMID: 25789545 Free PMC article. - Mps1-mediated release of Mad1 from nuclear pores ensures the fidelity of chromosome segregation.
Cunha-Silva S, Osswald M, Goemann J, Barbosa J, Santos LM, Resende P, Bange T, Ferrás C, Sunkel CE, Conde C. Cunha-Silva S, et al. J Cell Biol. 2020 Mar 2;219(3):e201906039. doi: 10.1083/jcb.201906039. J Cell Biol. 2020. PMID: 31913420 Free PMC article. - Roles of the nucleoporin Tpr in cancer and aging.
Snow CJ, Paschal BM. Snow CJ, et al. Adv Exp Med Biol. 2014;773:309-22. doi: 10.1007/978-1-4899-8032-8_14. Adv Exp Med Biol. 2014. PMID: 24563354 Review. - Versatility at the nuclear pore complex: lessons learned from the nucleoporin Nup153.
Ball JR, Ullman KS. Ball JR, et al. Chromosoma. 2005 Nov;114(5):319-30. doi: 10.1007/s00412-005-0019-3. Epub 2005 Nov 12. Chromosoma. 2005. PMID: 16133350 Review.
Cited by
- Tpr regulates the total number of nuclear pore complexes per cell nucleus.
McCloskey A, Ibarra A, Hetzer MW. McCloskey A, et al. Genes Dev. 2018 Oct 1;32(19-20):1321-1331. doi: 10.1101/gad.315523.118. Epub 2018 Sep 18. Genes Dev. 2018. PMID: 30228202 Free PMC article. - AKAP95 interacts with nucleoporin TPR in mitosis and is important for the spindle assembly checkpoint.
López-Soop G, Rønningen T, Rogala A, Richartz N, Blomhoff HK, Thiede B, Collas P, Küntziger T. López-Soop G, et al. Cell Cycle. 2017 May 19;16(10):947-956. doi: 10.1080/15384101.2017.1310350. Epub 2017 Apr 5. Cell Cycle. 2017. PMID: 28379780 Free PMC article. - Tpr Misregulation in Hippocampal Neural Stem Cells in Mouse Models of Alzheimer's Disease.
Malik SC, Lin JD, Ziegler-Waldkirch S, Tholen S, Deshpande SS, Schwabenland M, Schilling O, Vlachos A, Meyer-Luehmann M, Schachtrup C. Malik SC, et al. Cells. 2023 Dec 1;12(23):2757. doi: 10.3390/cells12232757. Cells. 2023. PMID: 38067185 Free PMC article. - Delineating FtsQ-mediated regulation of cell division in Mycobacterium tuberculosis.
Jain P, Malakar B, Khan MZ, Lochab S, Singh A, Nandicoori VK. Jain P, et al. J Biol Chem. 2018 Aug 10;293(32):12331-12349. doi: 10.1074/jbc.RA118.003628. Epub 2018 Jun 14. J Biol Chem. 2018. PMID: 29903917 Free PMC article. - Structural Basis of TPR-Mediated Oligomerization and Activation of Oncogenic Fusion Kinases.
Pal K, Bandyopadhyay A, Zhou XE, Xu Q, Marciano DP, Brunzelle JS, Yerrum S, Griffin PR, Vande Woude G, Melcher K, Xu HE. Pal K, et al. Structure. 2017 Jun 6;25(6):867-877.e3. doi: 10.1016/j.str.2017.04.015. Epub 2017 May 18. Structure. 2017. PMID: 28528776 Free PMC article.
References
- Ahonen L. J., Kallio M. J., Daum J. R., Bolton M., Manke I. A., Yaffe M. B., Stukenberg P. T., Gorbsky G. J. (2005). Polo-like kinase 1 creates the tension-sensing 3F3/2 phosphoepitope and modulates the association of spindle-checkpoint proteins at kinetochores. Curr. Biol. 15, 1078–1089 10.1016/j.cub.2005.05.026 - DOI - PubMed
- Bodoor K., Shaikh S., Salina D., Raharjo W. H., Bastos R., Lohka M., Burke B. (1999). Sequential recruitment of NPC proteins to the nuclear periphery at the end of mitosis. J. Cell Sci. 112, 2253–2264 - PubMed
Publication types
MeSH terms
Substances
LinkOut - more resources
Full Text Sources
Other Literature Sources
Molecular Biology Databases
Miscellaneous
