Quantifying selection in immune receptor repertoires - PubMed (original) (raw)
Quantifying selection in immune receptor repertoires
Yuval Elhanati et al. Proc Natl Acad Sci U S A. 2014.
Abstract
The efficient recognition of pathogens by the adaptive immune system relies on the diversity of receptors displayed at the surface of immune cells. T-cell receptor diversity results from an initial random DNA editing process, called VDJ recombination, followed by functional selection of cells according to the interaction of their surface receptors with self and foreign antigenic peptides. Using high-throughput sequence data from the β-chain of human T-cell receptors, we infer factors that quantify the overall effect of selection on the elements of receptor sequence composition: the V and J gene choice and the length and amino acid composition of the variable region. We find a significant correlation between biases induced by VDJ recombination and our inferred selection factors together with a reduction of diversity during selection. Both effects suggest that natural selection acting on the recombination process has anticipated the selection pressures experienced during somatic evolution. The inferred selection factors differ little between donors or between naive and memory repertoires. The number of sequences shared between donors is well-predicted by our model, indicating a stochastic origin of such public sequences. Our approach is based on a probabilistic maximum likelihood method, which is necessary to disentangle the effects of selection from biases inherent in the recombination process.
Keywords: T cell; public repertoire; statistical inference; thymic selection.
Conflict of interest statement
The authors declare no conflict of interest.
Figures
Fig. 1.
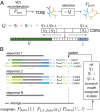
Graphical representation of our method. (A) T-cell receptor β-chain sequences are formed during VDJ recombination. Sequences from this probability distribution, described by _P_pre, are then selected with a factor Q defined for each sequence, resulting in the observed _P_post distribution of receptor sequences. Selection is assumed to act independently on the V and J genes, the length of the CDR3 region, and each of the amino acids, a i, therein. (B) A schematic of the fitting procedure: the parameters are set so that _P_post fits the marginal frequencies of amino acids at each position, the distribution of CDR3 lengths, and VJ gene choices. Because the latter is not known unambiguously from the observed sequences, it is estimated probabilistically using the model itself in an iterative procedure.
Fig. 2.
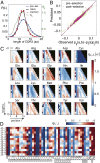
Characteristics of selection. (A) CDR3 length distributions pre- and postselection and the length selection factor q L (green). Selection makes the length distribution of CDR3 regions in the preselection repertoire more peaked for the naive and memory repertoires (overlapping). Error bars show standard deviation over nine individuals. (B) Comparison between data and the model of the connected pairwise correlation functions, which were not fitted by our model. The excellent agreement validates the inference procedure. As a control, the prediction from the preselection model (green) does not agree with the data as well. (C) Values of the inferred amino acid selection factors for each amino acid, ordered by length of the CDR3 region (ordinate) and position in the region (abscissa). (D) Values of the VJ gene selection factors.
Fig. 3.
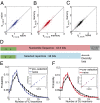
Repertoire diversity. (A–C) Variability between repertoires. The scatter between q i;L selection factors between two sample individuals A and B for (A) naive and (B) memory repertoires compared with that of (C) memory and naive repertoires for the same individual shows great similarity between them (
SI Appendix, Fig. S4
). (D) The entropy of the preselection repertoire (Upper) is reduced in the postselection repertoire (Lower). (E and F) Distribution of (E) VJ and (F) DJ insertions in the preselection and naive repertoires shows elimination of long insertions. Error bars show standard deviations over nine donors. The insertion distributions for the memory repertoire are the same as for the naive repertoire (scatter plots in Insets).
Fig. 4.
Probability of passing selection. (A and B) Ratio of the distributions of sequence-wide selection factors Q between the observed sequences and the preselection ensemble (red line), plotted as a function of Q for (A) naive and (B) memory repertoires. The model prediction _P_post(Q)/_P_pre(Q) = Q is shown in black, and the preselection and observed distributions of Q are shown in Insets. The selection ratio saturates around approximately seven, which may be interpreted as the maximum probability of being selected. Naive and memory repertoires show similar behaviors. (C) A cartoon of the effective selection landscape captured by our model (red line). Our method does not capture localized selection pressures (such as avoiding self) specific to each individual but captures general global properties.
Fig. 5.
Correlations between the pre- and postselection repertoires. (A) A histogram of Spearman correlation coefficient (CC) values between the q i;L(a) selection factors in the CDR3 region and their generation probabilities P i:L,pre(a) for all i, L shows an abundance of positive correlations. (B) Heat map of the joint distribution of the preselection probability distribution _P_pre and selection factors Q for each sequence shows that the two quantities are correlated. (C) Sequences in the observed selected repertoire (green line) had a higher probability to have been generated by recombination than unselected sequences (blue line). Agreement between the postselection model (red line) and data distribution (green line) is a validation of the model.
Fig. 6.
Shared sequences between individuals. (A) The mean number of shared sequences between any pair of individuals compared with the number expected by chance (model prediction) for one common model for all individuals (red crosses) and private models learned independently for each individual (blue crosses). Error bars are standard deviations from distributions over pairs. The distribution of shared sequences between (B) triplets and (C) quadruplets of individuals for the data (black histogram) from common (red line) and private (blue line) models. (D) The shared sequences are most likely to be generated and selected: comparison of the _P_post postselection distribution for sequences from the preselection (dotted line) and postselection repertoires (according to the model in gray and the data in black) as well as the sequences shared by at least two donors (model prediction in magenta and data in red).
Similar articles
- Statistical inference of the generation probability of T-cell receptors from sequence repertoires.
Murugan A, Mora T, Walczak AM, Callan CG Jr. Murugan A, et al. Proc Natl Acad Sci U S A. 2012 Oct 2;109(40):16161-6. doi: 10.1073/pnas.1212755109. Epub 2012 Sep 17. Proc Natl Acad Sci U S A. 2012. PMID: 22988065 Free PMC article. - Preselection TCR repertoire predicts CD4+ and CD8+ T-cell differentiation state.
Hou X, Chen W, Zhang X, Wang G, Chen J, Zeng P, Fu X, Zhang Q, Liu X, Diao H. Hou X, et al. Immunology. 2020 Dec;161(4):354-363. doi: 10.1111/imm.13256. Epub 2020 Oct 7. Immunology. 2020. PMID: 32875554 Free PMC article. - Insights into immune system development and function from mouse T-cell repertoires.
Sethna Z, Elhanati Y, Dudgeon CS, Callan CG Jr, Levine AJ, Mora T, Walczak AM. Sethna Z, et al. Proc Natl Acad Sci U S A. 2017 Feb 28;114(9):2253-2258. doi: 10.1073/pnas.1700241114. Epub 2017 Feb 14. Proc Natl Acad Sci U S A. 2017. PMID: 28196891 Free PMC article. - Thymic commitment of regulatory T cells is a pathway of TCR-dependent selection that isolates repertoires undergoing positive or negative selection.
Coutinho A, Caramalho I, Seixas E, Demengeot J. Coutinho A, et al. Curr Top Microbiol Immunol. 2005;293:43-71. doi: 10.1007/3-540-27702-1_3. Curr Top Microbiol Immunol. 2005. PMID: 15981475 Review. - Predicting the spectrum of TCR repertoire sharing with a data-driven model of recombination.
Elhanati Y, Sethna Z, Callan CG Jr, Mora T, Walczak AM. Elhanati Y, et al. Immunol Rev. 2018 Jul;284(1):167-179. doi: 10.1111/imr.12665. Immunol Rev. 2018. PMID: 29944757 Free PMC article. Review.
Cited by
- Combining mutation and recombination statistics to infer clonal families in antibody repertoires.
Spisak N, Athènes G, Dupic T, Mora T, Walczak AM. Spisak N, et al. Elife. 2024 Aug 9;13:e86181. doi: 10.7554/eLife.86181. Elife. 2024. PMID: 39120133 Free PMC article. - Aberrant adaptive immune response underlies genetic susceptibility to tuberculosis.
Tsareva A, Shelyakin PV, Shagina IA, Myshkin MY, Merzlyak EM, Kriukova VV, Apt AS, Linge IA, Chudakov DM, Britanova OV. Tsareva A, et al. Front Immunol. 2024 May 10;15:1380971. doi: 10.3389/fimmu.2024.1380971. eCollection 2024. Front Immunol. 2024. PMID: 38799462 Free PMC article. - Principles and therapeutic applications of adaptive immunity.
Chi H, Pepper M, Thomas PG. Chi H, et al. Cell. 2024 Apr 25;187(9):2052-2078. doi: 10.1016/j.cell.2024.03.037. Cell. 2024. PMID: 38670065 Free PMC article. Review. - Detecting T-cell clonal expansions and quantifying clone survival using deep profiling of immune repertoires.
Pavlova AV, Zvyagin IV, Shugay M. Pavlova AV, et al. Front Immunol. 2024 Apr 3;15:1321603. doi: 10.3389/fimmu.2024.1321603. eCollection 2024. Front Immunol. 2024. PMID: 38633256 Free PMC article. - How persistent infection overcomes peripheral tolerance mechanisms to cause T cell-mediated autoimmune disease.
Yin R, Melton S, Huseby ES, Kardar M, Chakraborty AK. Yin R, et al. Proc Natl Acad Sci U S A. 2024 Mar 12;121(11):e2318599121. doi: 10.1073/pnas.2318599121. Epub 2024 Mar 6. Proc Natl Acad Sci U S A. 2024. PMID: 38446856 Free PMC article.
References
- Janeway C. Immunobiology, the Immune System in Health and Disease. New York: Garland; 2005.
Publication types
MeSH terms
Substances
LinkOut - more resources
Full Text Sources
Other Literature Sources


