High-sensitivity measurements of multiple kinase activities in live single cells - PubMed (original) (raw)
High-sensitivity measurements of multiple kinase activities in live single cells
Sergi Regot et al. Cell. 2014.
Abstract
Increasing evidence has shown that population dynamics are qualitatively different from single-cell behaviors. Reporters to probe dynamic, single-cell behaviors are desirable yet relatively scarce. Here, we describe an easy-to-implement and generalizable technology to generate reporters of kinase activity for individual cells. Our technology converts phosphorylation into a nucleocytoplasmic shuttling event that can be measured by epifluorescence microscopy. Our reporters reproduce kinase activity for multiple types of kinases and allow for calculation of active kinase concentrations via a mathematical model. Using this technology, we made several experimental observations that had previously been technicallyunfeasible, including stimulus-dependent patterns of c-Jun N-terminal kinase (JNK) and nuclear factor kappa B (NF-κB) activation. We also measured JNK, p38, and ERK activities simultaneously, finding that p38 regulates the peak number, but not the intensity, of ERK fluctuations. Our approach opens the possibility of analyzing a wide range of kinase-mediated processes in individual cells.
Copyright © 2014 Elsevier Inc. All rights reserved.
Figures
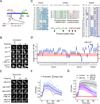
Figure 1. Development of Kinase Translocation Reporter (KTR) technology
(A) Schematic representation of mouse c-Jun protein showing JNK docking site (JNK DS), phosphorylation sites (P-sites), basic leucine zipper DNA binding domain (b-ZIP) and nuclear localization signal (NLS). Consensus nuclear export signal (NES, Φ indicates hydrophobic amino acid) and serine 73 sequence context are shown. (B) 3T3 cells expressing indicated c-Jun fragments fused to Clover were stimulated with anisomycin (50 ng/ml) and imaged at indicated time points. Where indicated (+ JNK inh.), cells were preincubated for 45 minutes with 10μM JNK inhibitor VIII. Representative cells are shown for each construct or condition. (C) Engineered protein sequences aligned to the wild type c-Jun sequence. Residues involved in nuclear import, nuclear export or phosphorylation are shown in green, purple or bold respectively. Changes from wild type sequence are highlighted in blue. (D) 3T3 cells expressing the Jun29-84-Clover variants shown in panel c were treated with anisomycin (50 ng/ml) and imaged over time. Dynamic range was calculated for each cell as (anisomycin-basal)/basal C/N ratio and normalized by the mean wild type dynamic range. Pink band corresponds to the observed wild type dynamic range variation. Data is represented as the mean ± standard deviation (SD) from more than 50 cells for each variant. (E) 3T3 cells expressing JNK KTR (WT or with phosphoresidues mutated to alanine, AA, or glutamate, EE) were stimulated with anisomycin (50 ng/ml) and imaged at indicated time points. Where indicated (+ JNK inh. or + p38 inh.), cells were preincubated for 45 minutes with 10μM JNK inhibitor VIII or 10μM SB203580. Representative cells are shown for each construct or condition. (F) 3T3 JNK KTR cells were stimulated with anisomycin (50ng/ml), imaged and quantified as described in Methods. C/N refers to cytoplasmic over nuclear intensities. Data is represented as the mean ± SD from 158 cells. (G) 3T3 JNK KTR cells were pretreated with 10μM JNK inhibitor VIII or 10μM SB203580 (JNK inh. and p38 inh. respectively) and stimulated with anisomycin (50 ng/ml). When indicated (JNK inh. at t120) cells were treated with 10μM JNK inhibitor VIII. Images were quantified as described in Methods. Data represents mean ± SD from more than 100 cells. See also Figures S1 and S2
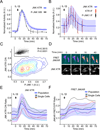
Figure 2. JNK KTR dynamics validation
(A) JNK KTR cells were stimulated with IL-1β (1 ng/ml), imaged and quantified as described in Methods. Three independent experiments were performed resulting in 980 single cells measured. KTR data represents the mean ± SD from the 3 experiment means (averaged to mimic in silico WBs). P-JNK WB data is calculated as the fraction of phosphorylated over total and represents the mean ± SD from 3 independent experiments. All datasets were normalized between 0 and 1 for comparison. (B) 3T3 JNK KTR cells were stimulated with IL-1β (1 ng/ml) for indicated times and fixed with 4% PFA for quantitative IF analysis. 10 images were taken for each time point and quantified as described in Methods. For each cell C/N KTR ratio (red) and phospho-JNK intensity (black) were determined. All datasets were normalized between 0 and 1 for comparison. Data represents the mean ± SD from more than 500 cells for each time point obtained from 2 independent experiments. IF data is overlaid on the dynamic JNK KTR dataset (blue) used in Figure S6. Note that in this case, JNK KTR dynamic data represents the mean ± SD from all individual cells (n=980), obtained in 3 independent experiments. (C) IF data obtained in Panel b represented as contour scatter plot. Single cell JNK KTR ratio and phospho-JNK intensity from all time points are shown. Contour color represent areas of increasing data point density. Raw scatter plots fitted to a linear regression are shown together with Pearson correlation value R and P values. (D) 3T3 JNK KTR cells and 3T3 expressing FRET JNK Activity Reporter (JNKAR) were stimulated with IL-1β (1 ng/ml) and imaged at indicated time points. FRET image was calculated as described in Methods. Representative cells are shown for each technique over time. (E) 3T3 JNK KTR single cell dynamic data used in Figure S7. 5 randomly selected single cell traces are shown. (F) FRET JNKAR cells were stimulated with IL-1β (1 ng/ml) imaged and quantified as described in Methods. Data represents the mean ± SD from all individual cells (n=67) obtained from 2 independent experiments. 5 randomly selected single cell traces are shown. See also Figure S3.
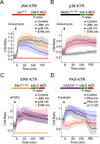
Figure 3. KTR technology is generalizable to other kinases
(A) 3T3 cells expressing JNK KTR were stimulated with anisomycin (50 ng/ml), imaged and quantified as described in Methods. Schematic representation of the engineered reporter is shown for all panels. Data represents the mean ±SD of more than 100 cells. Cells were preincubated with media (Control), 10 μM JNK inhibitor VIII (JNK inh.), 10 μM SB203580 (p38 inh.) or 100 nM PD032591 (ERK inh.). (B) 3T3 cells expressing p38 KTR were stimulated with anisomycin (50 ng/ml), imaged and quantified as described in Methods. Cells were pretreated or not with kinase inhibitors as in panel a. (C) 3T3 cells expressing ERK KTR were stimulated with basic fibroblast growth factor-2 (bFGF2, 100 ng/ml), imaged and quantified as described in Methods. Cells were pretreated or not with kinase inhibitors as in panel a. (D) 3T3 cells expressing PKA KTR were stimulated with the PKA activator forskolin (10 μM) imaged and quantified as described in Methods. Cells were pretreated with the specific PKA inhibitor H89 (30 μM) (+ PKA inh.) or not (Control). Where indicated H89 (30 μM) was added at time 120 minutes (+ PKA inh. at t=120). See also Figure S4.
Figure 4. KTR modeling allows estimating active JNK kinase concentration in single cells
(A) Schematic representation of the mathematical model, see Supplementary Equations for a complete description of the parameters depicted in this figure. (B) Model based relationship between steady state C/N JNK KTR ratio and concentration of active JNK. Grey areas indicate the range of C/N ratios observed (at basal or peak times) when cells are stimulated with 1 ng/ml IL-1β (data represents the distribution of C/N ratio between 25th and 75th percentiles). (C) 3T3 cells expressing JNK KTR Clover (solid line) and JNK KTRAEmRuby2 (super index indicates A and E mutations on the phosphorylation sites) (dashed line) were stimulated with IL-1β (1 ng/ml), imaged and quantified as described in Methods. The activation dynamics for each protein in four randomly chosen individual cells are shown. (D) Cells were treated as in Panel c. Corrected C/N ratio (blue line), estimated active kinase concentration obtained as described in Methods (green line) and fitted C/N ratio using the estimated concentration of active kinase for that particular cell (red dots) are shown for four randomly chosen individual cells. (E) Cells were treated as in Panel b. Each row of the heat map corresponds to an individual cell. Corrected JNK KTR C/N ratio and estimated concentration of active JNK are displayed in tandem for each cell. No normalization was used for the corrected JNK KTR C/N ratio. Heat maps represent 195 cells and two independent experiments. See also Figure S5.
Figure 5. KTR technology provides a new dimension for analyzing the innate immune signaling network
(A) RelA−/− 3T3 cells expressing H2B-EGFP and p65-DsRed were infected with JNK KTR-mCerulean3 and a clonal cell line was isolated (cell line 3B8). 3B8 cells were stimulated with TNF-α (10 ng/ml) and imaged at indicated times. Representative cells are shown for each channel over time. (B) Clonal line 3B8 was stimulated with the indicated concentration of TNF-α, IL-1β or LPS, imaged and quantified as described in Methods. Each row of the heat map corresponds to a single cell; JNK KTR and nuclear p65 (p65) dynamics are displayed in tandem for each cell (>300 cells total, three independent experiments), with each trace normalized between 0 and 1 for each reporter. (C) The amount of time elapsed at the first peak of activity for JNK KTR and p65-dsRed. Data comes from Panel b, and dot size represents the number of cells. Gray line indicates×= y (D) Clonal line 3B8 was stimulated with indicated concentrations of IL-1β, imaged and quantified as described in methods. 25 randomly chosen cells (blue) and the average of all cells (>300) (red) are shown. (E-J) 3B8 cells were stimulated with indicated concentrations of TNF-α (E and H), IL-1β (F and I) or LPS (G and J). Correlations between JNK KTR and p65 peak amplitude (E, F and G) or time to first peak (H, I and J) are shown. Dot size represents the number of cells. Gray line indicates×= y. See also Figures S6 and S7.
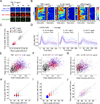
Figure 6. KTR technology allows output multiplexing
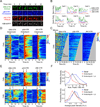
(A) 3T3 cells expressing indicated fusion proteins (4C cell line) were imaged under basal conditions over time. Representative cells are shown for each time point. (B and C) 4C cell line was imaged every 8 minutes without stimulation and quantified as described in Methods without stimulation. Six representative cells (b) and heat maps for 196 cells (c) are shown. For each cell, ERK, p38 and JNK KTRs were quantified from mitotic exit to mitotic entry. (D and E) 4C cell line was stimulated with Anisomycin (A) (50 ng/ml) where indicated (black arrow) and treated with 10 μM JNK inhibitor VIII (Ji) or 10 μM SB203580 (pi) (red or blue arrows respectively). Images were taken every 8 minutes and quantified as described in Methods. Heat maps for more than 100 cells are shown. (F) Peaks of ERK activity from data presented in Panels c and e were identified using custom software. Distributions of number of peaks per 500 minutes (top) and average peak intensity (bottom) are shown for 3 conditions; No stimuli (blue), Anisomycin 50 ng/ml (red) or Anisomycin 50 ng/ml and 10 μM SB203580 (pi) (black). See also Figure S7.
Comment in
- Live reporting of kinase dynamics.
Nawy T. Nawy T. Nat Methods. 2014 Aug;11(8):788-9. doi: 10.1038/nmeth.3058. Nat Methods. 2014. PMID: 25229097 No abstract available.
Similar articles
- NF-κB, ERK, p38 MAPK and JNK contribute to the initiation and/or maintenance of mechanical allodynia induced by tumor necrosis factor-alpha in the red nucleus.
Zhang Q, Wang J, Duan MT, Han SP, Zeng XY, Wang JY. Zhang Q, et al. Brain Res Bull. 2013 Oct;99:132-9. doi: 10.1016/j.brainresbull.2013.10.008. Epub 2013 Oct 23. Brain Res Bull. 2013. PMID: 24161765 - Galloyl benzamide-based compounds modulating tumour necrosis factor α-stimulated c-Jun N-terminal kinase and p38 mitogen-activated protein kinase signalling pathways.
Leo V, Stefanachi A, Nacci C, Leonetti F, de Candia M, Carotti A, Altomare CD, Montagnani M, Cellamare S. Leo V, et al. J Pharm Pharmacol. 2015 Oct;67(10):1380-92. doi: 10.1111/jphp.12438. Epub 2015 Jun 16. J Pharm Pharmacol. 2015. PMID: 26078032 - Transcriptional regulation of lysophosphatidic acid-induced interleukin-8 expression and secretion by p38 MAPK and JNK in human bronchial epithelial cells.
Saatian B, Zhao Y, He D, Georas SN, Watkins T, Spannhake EW, Natarajan V. Saatian B, et al. Biochem J. 2006 Feb 1;393(Pt 3):657-68. doi: 10.1042/BJ20050791. Biochem J. 2006. PMID: 16197369 Free PMC article. - Tumor necrosis factor alpha-induced E-selectin expression is activated by the nuclear factor-kappaB and c-JUN N-terminal kinase/p38 mitogen-activated protein kinase pathways.
Read MA, Whitley MZ, Gupta S, Pierce JW, Best J, Davis RJ, Collins T. Read MA, et al. J Biol Chem. 1997 Jan 31;272(5):2753-61. doi: 10.1074/jbc.272.5.2753. J Biol Chem. 1997. PMID: 9006914
Cited by
- Establishment of a fluorescent reporter of RNA-polymerase II activity to identify dormant cells.
Freter R, Falletta P, Omrani O, Rasa M, Herbert K, Annunziata F, Minetti A, Krepelova A, Adam L, Käppel S, Rüdiger T, Wang ZQ, Goding CR, Neri F. Freter R, et al. Nat Commun. 2021 Jun 3;12(1):3318. doi: 10.1038/s41467-021-23580-4. Nat Commun. 2021. PMID: 34083536 Free PMC article. - Single-cell dynamics and variability of MAPK activity in a yeast differentiation pathway.
Conlon P, Gelin-Licht R, Ganesan A, Zhang J, Levchenko A. Conlon P, et al. Proc Natl Acad Sci U S A. 2016 Oct 4;113(40):E5896-E5905. doi: 10.1073/pnas.1610081113. Epub 2016 Sep 20. Proc Natl Acad Sci U S A. 2016. PMID: 27651485 Free PMC article. - Reversible cryo-arrest for imaging molecules in living cells at high spatial resolution.
Masip ME, Huebinger J, Christmann J, Sabet O, Wehner F, Konitsiotis A, Fuhr GR, Bastiaens PIH. Masip ME, et al. Nat Methods. 2016 Aug;13(8):665-672. doi: 10.1038/nmeth.3921. Epub 2016 Jul 11. Nat Methods. 2016. PMID: 27400419 Free PMC article. - Extracellular matrix stiffness activates mechanosensitive signals but limits breast cancer cell spheroid proliferation and invasion.
Jahin I, Phillips T, Marcotti S, Gorey MA, Cox S, Parsons M. Jahin I, et al. Front Cell Dev Biol. 2023 Dec 6;11:1292775. doi: 10.3389/fcell.2023.1292775. eCollection 2023. Front Cell Dev Biol. 2023. PMID: 38125873 Free PMC article. - Signal Transduction at the Single-Cell Level: Approaches to Study the Dynamic Nature of Signaling Networks.
Handly LN, Yao J, Wollman R. Handly LN, et al. J Mol Biol. 2016 Sep 25;428(19):3669-82. doi: 10.1016/j.jmb.2016.07.009. Epub 2016 Jul 16. J Mol Biol. 2016. PMID: 27430597 Free PMC article. Review.
References
- Bagowski CP, Ferrell JE., Jr Bistability in the JNK cascade. Current biology : CB. 2001;11:1176–1182. - PubMed
Publication types
MeSH terms
Substances
Grants and funding
- R21 AI104305/AI/NIAID NIH HHS/United States
- DP1 LM011510/LM/NLM NIH HHS/United States
- P50 GM107615/GM/NIGMS NIH HHS/United States
- 5DP1LM01150-05/DP/NCCDPHP CDC HHS/United States
- R21 5R21AI104305-02/AI/NIAID NIH HHS/United States
- P50GM107615/GM/NIGMS NIH HHS/United States
- DP1 OD006413/OD/NIH HHS/United States
LinkOut - more resources
Full Text Sources
Other Literature Sources
Molecular Biology Databases
Research Materials
Miscellaneous
