Imaging the intracellular distribution of tyrosine kinase inhibitors in living cells with quantitative hyperspectral stimulated Raman scattering - PubMed (original) (raw)
Imaging the intracellular distribution of tyrosine kinase inhibitors in living cells with quantitative hyperspectral stimulated Raman scattering
Dan Fu et al. Nat Chem. 2014 Jul.
Abstract
ABL1 tyrosine-kinase inhibitors (TKI) are front-line therapy for chronic myelogenous leukaemia and are among the best-known examples of targeted cancer therapeutics. However, the dynamic uptake into cells of TKIs of low molecular weight and their intracellular behaviour is unknown because of the difficulty of observing non-fluorescent small molecules at subcellular resolution. Here we report the direct label-free visualization and quantification of two TKI drugs (imatinib and nilotinib) inside living cells using hyperspectral stimulated Raman scattering imaging. Concentrations of both drugs were enriched over 1,000-fold in lysosomes as a result of their lysosomotropic properties. In addition, low solubility appeared to contribute significantly to the surprisingly large accumulation of nilotinib. We further show that the lysosomal trapping of imatinib was reduced more than tenfold when chloroquine is used simultaneously, which suggests that chloroquine may increase the efficacy of TKIs through lysosome-mediated drug-drug interaction in addition to the commonly proposed autophagy-inhibition mechanism.
Figures
Figure 1. Structure and spectral properties of five drug molecules imatinib, nilotinib, chloroquine, GNF-2, and GNF-5
a, Chemical structures of the drug molecules. b, spontaneous Raman spectra of the drug molecules in the fingerprint region from 700 cm−1 to 1700 cm−1. The major peaks used for SRS imaging for each drug are marked with shaded vertical lines (~1300 cm−1 for imatinib and nilotinib, 1370 cm−1 for chloroquine, and ~1600 cm−1 for GNF2 and GNF5).
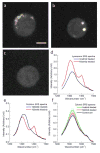
Figure 2. hsSRS microscopy reveals enrichment of drugs in living cells: the SRS spectra of bright spots in drug-treated cells match the SRS spectra of the drug in solution, but differ from that of cytosol
a, Representative SRS images at 1305 cm−1 of 20 μM imatinib treated BaF3/BCR-ABL1 cells for 4 hours. b, Representative SRS images at 1305 cm−1 of 20 μM nilotinib treated BaF3/BCR-ABL1 cells for 4 hours. c. Representative SRS images at 1305 cm−1 of control cells treated with DMSO. d, SRS spectra of selected ROI (yellow polygon) in a and b. e, SRS spectra of 100 mM imatinib and 100 mM nilotinib solutions. f, comparison of average SRS spectra of cytosol (excluding brighter regions, n = 6) of imatinib treated, nilotinib treated and control BaF3/BCR-ABL1 cells. Scale bar: 5 μm.
Figure 3. Accumulations of drugs in lysosomes are confirmed by simultaneous two-photon fluorescence imaging of lysotracker and SRS imaging of drug accumulation
a–b, Maximum intensity projection of three-dimensional SRS images at 1305 cm−1 (a) and Lysotracker-Red fluorescence images (b) of 20 μM imatinib treated BAF3/BCR-ABL1 cells for 4 hours. c, Spatial overlap of the fluorescence image (red) and SRS image (green). d–e, Maximum intensity projection of three-dimensional SRS images at 1305 cm−1 (d) and Lysotracker-Red fluorescence images (e) of 20 μM nilotinib treated BaF3 cells for 4 hours. f, Spatial overlap of the fluorescence image (red) and SRS image (green). g–h, Maximum intensity projection of three-dimensional SRS images at 1305 cm−1 (g) and Lysotracker-Red fluorescence images (h) of control BaF3 cells. Scale bar: 5μm. j, Modified thermodynamic equilibrium model on lysosomotropism which includes solubility equilibrium. Protonated drug (DH+) needs to be deprotonated (neutral form D) in order to diffuse through the plasma membrane and the lysosomal membrane. Inside the lysosome, the drug exists mainly in protonated form due to the low pH and is no longer membrane-permeable. When the concentration of the protonated drug goes beyond its solubility, it would precipitate (DH+A−) inside the lysosome with counter ion A−.
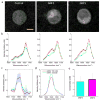
Figure 4. hsSRS imaging of intracellular uptake of GNF-2/GNF-5 drug show that only cytoplasm spectra has moderate intensity increases at ~1600 cm−1 due to drug accumulation
a, Representative SRS images at 1600 cm−1 of control BaF3/BCR-ABL1 cells, GNF-2 treated BaF3/BCR-ABL1 cells, and GNF-5 treated BaF3 cells show that both GNF-2 and GNF-5 selectively accumulate in the cytoplasm. b, Average SRS spectra (n =6) of cytosol (red), and nucleus (green) for control cells, GNF-2 treated cells, and GNF-5 treated cells. c, Subtraction of GNF-2 cytoplasm-nucleus difference spectra with that of control (pink) and subtraction of GNF5 cytoplasm-nucleus difference spectra with that of control cell (cyan). d, SRS spectra of 100 mM GNF-2 and GNF-5 solutions. Shaded area of the same color indicated the standard deviation of SRS spectral measurement on six cells. e, Calculated concentrations of GNF2 and GNF5 in the cytoplasm of drug treated BaF3/BCR-ABL1 cells. Scale bar: 5 μm.
Figure 5. Time course of lysosomal drug uptake monitored by hsSRS imaging reveal that both imatinib and nilotinib are enriched over 1000-fold in the lysosome within a few hours, and they do not reach steady-state even after 8 hours; the rate of nilotinib enrichment is higher than that of imatinib
a, Average SRS spectra of lysosome (blue), cytosol (red) and nucleus (blue) at 1, 2, 4 and 8 hours for imatinib treated BaF3/BCR-ABL1 cells (n=6). Shaded curves show corresponding standard deviation of the spectra of different cells. At 8 hrs, the nuclei of some cells were not visible and therefore the nucleus spectra were not plotted for imatinib treated cells. b, Average SRS spectra of lysosome (blue), cytosol (red) and nucleus (blue) at 1, 2, 4 and 8 hours for nilotinib treated BaF3/BCR-ABL1 cells (n=6). c–d, Lysosomal drug concentration increases with incubation time as calculated from SRS spectra in a and b, respectively. The error bars are standard deviations of calculated drug concentrations of the six cell samples at each time point.
Figure 6. Intracellular interaction of TKI drugs with chloroquine measured by hsSRS imaging show that the increase of chloroquine accumulation (SRS peak at 1370 cm−1) in the lysosome significantly reduce imatinib but not nilotinib enrichment in the lysosome (both have SRS peak at 1305 cm−1)
a–c, e–g, SRS spectra of lysosomes, cytosol and nucleus for BaF3/BCR-ABL1 cells treated with different combinations of drugs for 3 hours: 20 μM imatinib (a), 20 μM imatinib + 20 μM chloroquine (b), 20 μM imatinib + 50 μM chloroquine (c), 20 μM nilotinib (e), 20 μM nilotinib + 20 μM chloroquine (f), and 20 μM nilotinib + 50 μM chloroquine (g). d, h, To visualize the drug accumulation induced spectra change, the difference spectra of lysosome and cytosol are plotted: difference spectra of imatinib treated cells at increasing chloroquine concentrations corresponding to a (red), b (green) and c (blue), respectively (d) and difference spectra of nilotinib treated cells at different chloroquine concentrations corresponding to e (red), f (green) and g (blue), respectively (h). Shaded curves show corresponding standard deviation of measurement on six different cells.
Similar articles
- Expression of LYN and PTEN genes in chronic myeloid leukemia and their importance in therapeutic strategy.
Ferri C, Bianchini M, Bengió R, Larripa I. Ferri C, et al. Blood Cells Mol Dis. 2014 Feb-Mar;52(2-3):121-5. doi: 10.1016/j.bcmd.2013.09.002. Epub 2013 Oct 3. Blood Cells Mol Dis. 2014. PMID: 24091144 - Clinical pharmacokinetics of tyrosine kinase inhibitors: focus on pyrimidines, pyridines and pyrroles.
Di Gion P, Kanefendt F, Lindauer A, Scheffler M, Doroshyenko O, Fuhr U, Wolf J, Jaehde U. Di Gion P, et al. Clin Pharmacokinet. 2011 Sep;50(9):551-603. doi: 10.2165/11593320-000000000-00000. Clin Pharmacokinet. 2011. PMID: 21827214 - A retrospective study of the prescribing and outcomes of tyrosine kinase inhibitors in chronic myeloid leukaemia over a period of more than 10 years.
Lang AS, Mounier M, Roques M, Chretien ML, Boulin M. Lang AS, et al. J Clin Pharm Ther. 2015 Aug;40(4):391-7. doi: 10.1111/jcpt.12273. Epub 2015 Apr 10. J Clin Pharm Ther. 2015. PMID: 25865674 - Use of tyrosine kinase inhibitors for chronic myeloid leukemia: management of patients and practical applications for pharmacy practitioners.
Wong SF, Mirshahidi H. Wong SF, et al. Ann Pharmacother. 2011 Jun;45(6):787-97. doi: 10.1345/aph.1P784. Epub 2011 Jun 13. Ann Pharmacother. 2011. PMID: 21672900 Review. - Comparative Effectiveness of Newer Tyrosine Kinase Inhibitors Versus Imatinib in the First-Line Treatment of Chronic-Phase Chronic Myeloid Leukemia Across Risk Groups: A Systematic Review and Meta-Analysis of Eight Randomized Trials.
Yun S, Vincelette ND, Segar JM, Dong Y, Shen Y, Kim DW, Abraham I. Yun S, et al. Clin Lymphoma Myeloma Leuk. 2016 Jun;16(6):e85-94. doi: 10.1016/j.clml.2016.03.003. Epub 2016 Mar 30. Clin Lymphoma Myeloma Leuk. 2016. PMID: 27101984 Review.
Cited by
- Biological imaging of chemical bonds by stimulated Raman scattering microscopy.
Hu F, Shi L, Min W. Hu F, et al. Nat Methods. 2019 Sep;16(9):830-842. doi: 10.1038/s41592-019-0538-0. Epub 2019 Aug 30. Nat Methods. 2019. PMID: 31471618 Review. - Ratiometric imaging of minor groove binders in mammalian cells using Raman microscopy.
Tentellino C, Tipping WJ, McGee LMC, Bain LM, Wetherill C, Laing S, Tyson-Hirst I, Suckling CJ, Beveridge R, Scott FJ, Faulds K, Graham D. Tentellino C, et al. RSC Chem Biol. 2022 Sep 26;3(12):1403-1415. doi: 10.1039/d2cb00159d. eCollection 2022 Nov 30. RSC Chem Biol. 2022. PMID: 36544571 Free PMC article. - The Role of NLRP3, a Star of Excellence in Myeloproliferative Neoplasms.
Parciante E, Cumbo C, Anelli L, Zagaria A, Redavid I, Minervini A, Conserva MR, Tota G, Coccaro N, Tarantini F, Minervini CF, Macchia MG, Specchia G, Musto P, Albano F. Parciante E, et al. Int J Mol Sci. 2023 Mar 2;24(5):4860. doi: 10.3390/ijms24054860. Int J Mol Sci. 2023. PMID: 36902299 Free PMC article. Review. - Broadband coherent Raman spectroscopy running at 24,000 spectra per second.
Hashimoto K, Takahashi M, Ideguchi T, Goda K. Hashimoto K, et al. Sci Rep. 2016 Feb 15;6:21036. doi: 10.1038/srep21036. Sci Rep. 2016. PMID: 26875786 Free PMC article. - Oncogenic signaling by Kit tyrosine kinase occurs selectively on the Golgi apparatus in gastrointestinal stromal tumors.
Obata Y, Horikawa K, Takahashi T, Akieda Y, Tsujimoto M, Fletcher JA, Esumi H, Nishida T, Abe R. Obata Y, et al. Oncogene. 2017 Jun 29;36(26):3661-3672. doi: 10.1038/onc.2016.519. Epub 2017 Feb 13. Oncogene. 2017. PMID: 28192400 Free PMC article.
References
- Melo JV, Barnes DJ. Chronic myeloid leukaemia as a model of disease evolution in human cancer. Nat Rev Cancer. 2007;7:441–453. - PubMed
- Manley PW, et al. Structural resemblances and comparisons of the relative pharmacological properties of imatinib and nilotinib. Biorg Med Chem. 2010;18:6977–6986. - PubMed
- Adrian FJ, et al. Allosteric inhibitors of Bcr-abl-dependent cell proliferation. Nat Chem Biol. 2006;2:95–102. - PubMed
Publication types
MeSH terms
Substances
LinkOut - more resources
Full Text Sources
Other Literature Sources
Miscellaneous


