Structural insights into the stabilization of MALAT1 noncoding RNA by a bipartite triple helix - PubMed (original) (raw)
Structural insights into the stabilization of MALAT1 noncoding RNA by a bipartite triple helix
Jessica A Brown et al. Nat Struct Mol Biol. 2014 Jul.
Abstract
Metastasis-associated lung adenocarcinoma transcript 1 (MALAT1) is a highly abundant nuclear long noncoding RNA that promotes malignancy. A 3'-stem-loop structure is predicted to confer stability by engaging a downstream A-rich tract in a triple helix, similar to the expression and nuclear retention element (ENE) from the KSHV polyadenylated nuclear RNA. The 3.1-Å-resolution crystal structure of the human MALAT1 ENE and A-rich tract reveals a bipartite triple helix containing stacks of five and four U•A-U triples separated by a C+•G-C triplet and C-G doublet, extended by two A-minor interactions. In vivo decay assays indicate that this blunt-ended triple helix, with the 3' nucleotide in a U•A-U triple, inhibits rapid nuclear RNA decay. Interruption of the triple helix by the C-G doublet induces a 'helical reset' that explains why triple-helical stacks longer than six do not occur in nature.
Figures
Figure 1. Overview of ENE+A structures and their importance for RNA accumulation
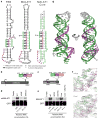
(a) Schematic diagrams of ENE+A structures from KSHV PAN RNA and human MALAT1 alongside the MALAT1 ENE+A core, which was used for structure determination (panel g). The U-rich internal loops are green and the poly(A) tail or A-rich tracts are purple. In the MALAT1 ENE+A core, the non-native sequence is gray. U→C denotes the U8275C mutation in the MALAT1 ENE. The U6612C mutant in the mMALAT ENE is analogous to U8275C in the human MALAT1 ENE as shown in Supplementary Tables 1 and 2. Hydrogen-bonding interactions are indicated as a dash (−) for Watson-Crick base pairs, a dot (•) for non-canonical base pairs, Leontis-Westhof notation for Hoogsteen base pairs, and double dashes (--) for A-minor interactions with the corresponding G-C base pair. (b) and (c) Schematic diagrams of the constructs containing either (b) full-length mouse MALAT1 (mMALAT1) or (c) a ~2-kb fragment of the 3′ end from human MALAT1. The ENE (green), A-rich tract (purple) and mascRNA (orange, masc) sequences are expanded in the insets. Expression is driven by a cytomegalovirus (CMV) promoter while 3′-end processing occurs via RNase P cleavage (arrowhead). (d) and (e) Northern blots were probed for GFP and either (d) mMALAT1 or (e) human MALAT1 RNAs. Relative RNA accumulation was quantitated by normalizing the MALAT1 signal to the GFP signal, which served as a loading and transfection control. The WT plasmid level was set at 100%. Values are the average of three biological replicates ± standard deviation. Uncropped blot images are in Supplementary Figure 7. (f) Initial experimental electron density for a region of the triple helix in molecule A at 3.4 Å resolution contoured at 1.5 (upper panel) and final 2Fo-Fc electron density for the same region at 3.1 Å resolution contoured at 1.5 σ (lower panel). (g) The crystal structure of the MALAT1 ENE+A core RNA is depicted with the ENE in green, A-rich tract in purple and non-native sequence in gray. Two cartoon representations (75° rotation) are shown.
Figure 2. Hydrogen-bonding interactions in the triple helix of the MALAT1 ENE+A core RNA
(a) Schematic diagram of the MALAT1 ENE+A core structure using the notation for hydrogen bonds defined in Figure 1a. The major structural regions are labeled on the right in black; the U•A-U triples are numbered on the left in blue. (b) Potential hydrogen-bonding interactions (≤ 3.2 Å) for two different major-groove base triples, U•A-U[3] and C+•G-C, are shown with blue dashed lines. (c) Stick representation of A-minor interactions with hydrogen bonds represented by blue dashed lines. The A-minor interactions mediated by A65 and A64 are of type I and type II, respectively. (d) Potential hydrogen bonds (blue dashed line) between the 2′-OH (green spheres) of the Hoogsteen strands and O2P (purple spheres) of the Watson strands (A-rich tract) are shown in a close-up view for U11•A70 and C12•G71 (left panel) and in a view down the helical axis for all triples numbered in (a) (right panel). Distances too long for hydrogen bonding are indicated by black dashed lines.
Figure 3. Structural features of the C•G-C/C-G in the MALAT1 ENE+A core
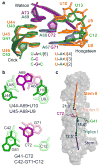
(a) Overlay of C•G-C, C-G and U•A-U[6] (ENE is green and A-rich tract is purple) with U•A-U[2], U•A-U[3] and U•A-U[4] (ENE is yellow and A-rich tract is blue) from the MALAT1 ENE+A core structure. Individual nucleotides are labeled. The similar Watson and Crick strands are displayed as cartoons while the dissimilar Hoogsteen strands are shown as sticks. (b) Base-stacking interactions are shown for U9•A68-U45 and U10•A69-U44 and C12•G71-C42 and C72-G41. The light and dark colors represent bases in the background and foreground, respectively. (c) Schematic of the local helical axes for stem I (dark blue), triplex I (light blue), triplex II (yellow) and stem II (red) overlaid on the MALAT1 ENE+A core structure (gray surface). The C72-G41 doublet is shown in purple and green sticks, respectively. Angles between the helical axes are shown.
Figure 4. Destabilizing structural features predicted between extended Hoogsteen and Watson strands of RNA triplexes
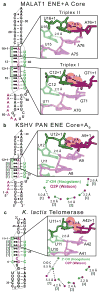
(a) Computational extension of the Hoogsteen (green sticks) and Watson (purple sticks) strands in both triplex I (lower) and triplex II (upper) of the MALAT1 ENE+A core structure generates a steric clash between the 2′-OH of the Hoogsteen strand and O2P of the Watson strand at the n+1 position (black dashed outline) for C•G-C and U•A-U[9]. Coordinates for the extended Hoogsteen and Watson strands were generated by superimposing the respective strand offset by one nucleotide (e.g. residue “n-2” onto residue “n-1” so that residue “n” advances to “n+1”). RMSD values for the superimposed strands were 0.52 and 0.63 Å for extension of the Hoogsteen strands (light green) in triplex I and II, respectively, and 0.45 and 0.91 Å for extension of the Watson strands (light purple) in triplex I and II, respectively. (b) and (c) Extension of the Hoogsteen and Watson strands (upper right) for the (b) KSHV PAN ENE core and oligo A9 (ref. ) and (c) K. lactis telomerase structures were performed as described in panel (a). For KSHV PAN ENE core+A9, RMSD values for the superimposed Hoogsteen and Watson strands were 0.33 and 0.59 Å, respectively. For K. lactis telomerase, RMSD values were 0.98 and 0.85 Å for the superimposed Hoogsteen and Watson strands, respectively. The lower right diagrams in (b) and (c) display the distances between the 2′-OH (green sphere) of the Hoogsteen strand and O2P (purple sphere) of the Watson strand in a view down the axis; dashed lines are as defined in Figure 2d. Blue numbers correspond to the numbered triples in the schematic (left). The advanced Hoogsteen base pair (“n+1”) is included in the schematic diagrams.
Figure 5. The MALAT1 ENE+A exhibits a single phase of RNA decay in vivo
(a) Schematic diagrams are shown for the βΔ1,2 constructs containing a tetracycline-responsive promoter (TRP) and bovine growth hormone polyA signal (BGH pA). Transcripts containing the mascRNA segment (orange, masc) undergo 3′-end processing via RNase P cleavage whereas the other transcripts undergo cleavage and polyadenylation. The resulting ENE (green) structures engage a genomically-encoded A-rich tract or the poly(A) tail (purple), respectively. (b) Schematic diagrams of the KSHV PAN ENE and MALAT1 ENE structures tested in the decay assays. Hydrogen-bonding interactions are as defined in Figure 1a. (c) Representative Northern blots probed for β-globin and 7SL RNAs show the amount of mRNA remaining at different times after the pulse for each construct: TRP-βΔ1,2-MALAT1 ENE+A+mascRNA WT (green), TRP-βΔ1,2-MALAT1 ENE+A+mascRNA U8275C (blue), TRP-βΔ1,2 (black), TRP-βΔ1,2-KSHV PAN ENE (purple) and TRP-βΔ1,2-KSHV PAN ENE+A+mascRNA with C•G-C (red). Uncropped blot images are in Supplementary Figure 7. (d) Northern blot data were quantitated by normalizing the β-globin signal to the 7SL signal, which serves as a loading control. The end of the transcriptional pulse is labeled as time zero and set at 100%. Values are the average of three biological replicates ± standard deviation. Curve colors correspond to the constructs in (c). The inset of each plot shows the first 2 h to emphasize biphasic nature of the curves for βΔ1,2 (black) and βΔ1,2-KSHV PAN ENE (purple) transcripts.
Figure 6. Accumulation levels of βΔ1,2-MALAT1 ENE+A+mascRNA containing mutations in the C•G-C and C-G nucleotides
(a) A schematic of the βΔ1,2-MALAT1 ENE+A+mascRNA construct containing a CMV promoter and BGH pA. The transcript containing the MALAT1 ENE (green), A-rich tract (purple) and mascRNA (orange, masc) undergoes 3′-end processing via RNase P cleavage (arrowhead). (b) Schematic of the MALAT1 ENE+A structure with interactions indicated as in Figure 1a. The blue and green boxes highlight mutation sites. (c) Northern blots (upper) were probed for β-globin and Neomycin resistance (NeoR) mRNAs. Black font denotes WT sequence, mutated nucleotides are red and Δ represents a nucleotide deletion. Results were quantitated (lower) by normalizing the β-globin signal to the NeoR signal, which served as a loading and transfection control. The WT βΔ1,2-MALAT1 ENE+A+mascRNA reporter level was set at an arbitrary value of 1. Relative accumulation is the average of five biological replicates; error bars represent standard deviation. Uncropped blot images are in Supplementary Figure 7. (d) Chemical structures showing the hydrogen-bonding interactions of three different bases triples: U•A-U, C+•G-C, and U•G-C.
Similar articles
- Formation of triple-helical structures by the 3'-end sequences of MALAT1 and MENβ noncoding RNAs.
Brown JA, Valenstein ML, Yario TA, Tycowski KT, Steitz JA. Brown JA, et al. Proc Natl Acad Sci U S A. 2012 Nov 20;109(47):19202-7. doi: 10.1073/pnas.1217338109. Epub 2012 Nov 5. Proc Natl Acad Sci U S A. 2012. PMID: 23129630 Free PMC article. - Methyltransferase-like protein 16 binds the 3'-terminal triple helix of MALAT1 long noncoding RNA.
Brown JA, Kinzig CG, DeGregorio SJ, Steitz JA. Brown JA, et al. Proc Natl Acad Sci U S A. 2016 Dec 6;113(49):14013-14018. doi: 10.1073/pnas.1614759113. Epub 2016 Nov 21. Proc Natl Acad Sci U S A. 2016. PMID: 27872311 Free PMC article. - tRNA-like leader-trailer interaction promotes 3'-end maturation of MALAT1.
Torabi SF, DeGregorio SJ, Steitz JA. Torabi SF, et al. RNA. 2021 Oct;27(10):1140-1147. doi: 10.1261/rna.078810.121. Epub 2021 Jul 12. RNA. 2021. PMID: 34253686 Free PMC article. - The emerging role of triple helices in RNA biology.
Conrad NK. Conrad NK. Wiley Interdiscip Rev RNA. 2014 Jan-Feb;5(1):15-29. doi: 10.1002/wrna.1194. Epub 2013 Sep 30. Wiley Interdiscip Rev RNA. 2014. PMID: 24115594 Free PMC article. Review. - Long noncoding RNAs: Re-writing dogmas of RNA processing and stability.
Wilusz JE. Wilusz JE. Biochim Biophys Acta. 2016 Jan;1859(1):128-38. doi: 10.1016/j.bbagrm.2015.06.003. Epub 2015 Jun 11. Biochim Biophys Acta. 2016. PMID: 26073320 Free PMC article. Review.
Cited by
- A Newly Identified Peripheral Duplex Anchors and Stabilizes the MALAT1 Triplex.
Mwangi MN, Yonkunas MJ, Ageeli AA, McGovern-Gooch KR, Yilmaz S, Baird NJ. Mwangi MN, et al. Biochemistry. 2024 Sep 17;63(18):2280-2292. doi: 10.1021/acs.biochem.4c00156. Epub 2024 Aug 27. Biochemistry. 2024. PMID: 39190685 Free PMC article. - Minimized human telomerase maintains telomeres and resolves endogenous roles of H/ACA proteins, TCAB1, and Cajal bodies.
Vogan JM, Zhang X, Youmans DT, Regalado SG, Johnson JZ, Hockemeyer D, Collins K. Vogan JM, et al. Elife. 2016 Aug 15;5:e18221. doi: 10.7554/eLife.18221. Elife. 2016. PMID: 27525486 Free PMC article. - Decrypting noncoding RNA interactions, structures, and functional networks.
Fabbri M, Girnita L, Varani G, Calin GA. Fabbri M, et al. Genome Res. 2019 Sep;29(9):1377-1388. doi: 10.1101/gr.247239.118. Epub 2019 Aug 21. Genome Res. 2019. PMID: 31434680 Free PMC article. Review. - Finely tuned conformational dynamics regulate the protective function of the lncRNA MALAT1 triple helix.
Ageeli AA, McGovern-Gooch KR, Kaminska MM, Baird NJ. Ageeli AA, et al. Nucleic Acids Res. 2019 Feb 20;47(3):1468-1481. doi: 10.1093/nar/gky1171. Nucleic Acids Res. 2019. PMID: 30462290 Free PMC article. - Regulation of DNA Double-Strand Break Repair by Non-Coding RNAs.
Thapar R. Thapar R. Molecules. 2018 Oct 27;23(11):2789. doi: 10.3390/molecules23112789. Molecules. 2018. PMID: 30373256 Free PMC article. Review.
References
- Qiu MT, Hu JW, Yin R, Xu L. Long noncoding RNA: an emerging paradigm of cancer research. Tumour Biol. 2013;34:613–20. - PubMed
- Gutschner T, Hammerle M, Diederichs S. MALAT1 - a paradigm for long noncoding RNA function in cancer. J Mol Med (Berl) 2013 - PubMed
- Schmidt LH, et al. The long noncoding MALAT-1 RNA indicates a poor prognosis in non-small cell lung cancer and induces migration and tumor growth. J Thorac Oncol. 2011;6:1984–92. - PubMed
- Xu C, Yang M, Tian J, Wang X, Li Z. MALAT-1: a long non-coding RNA and its important 3′ end functional motif in colorectal cancer metastasis. Int J Oncol. 2011;39:169–75. - PubMed
Publication types
MeSH terms
Substances
Grants and funding
- GM026154/GM/NIGMS NIH HHS/United States
- P41 GM111244/GM/NIGMS NIH HHS/United States
- P01 GM022778/GM/NIGMS NIH HHS/United States
- GM022778/GM/NIGMS NIH HHS/United States
- R01 GM026154/GM/NIGMS NIH HHS/United States
- HHMI/Howard Hughes Medical Institute/United States
LinkOut - more resources
Full Text Sources
Other Literature Sources
Miscellaneous


