The KASH protein Kms2 coordinates mitotic remodeling of the spindle pole body - PubMed (original) (raw)
. 2014 Aug 15;127(Pt 16):3625-40.
doi: 10.1242/jcs.154997. Epub 2014 Jun 24.
Affiliations
- PMID: 24963130
- PMCID: PMC4132395
- DOI: 10.1242/jcs.154997
The KASH protein Kms2 coordinates mitotic remodeling of the spindle pole body
Sarah Wälde et al. J Cell Sci. 2014.
Abstract
Defects in the biogenesis of the spindle pole body (SPB), the yeast centrosome equivalent, can lead to monopolar spindles and mitotic catastrophe. The KASH domain protein Kms2 and the SUN domain protein Sad1 colocalize within the nuclear envelope at the site of SPB attachment during interphase and at the spindle poles during mitosis in Schizosaccharomyces pombe. We show that Kms2 interacts with the essential SPB components Cut12 and Pcp1 and the Polo kinase Plo1. Depletion of Kms2 delays mitotic entry and leads to defects in the insertion of the SPB into the nuclear envelope, disrupting stable bipolar spindle formation. These effects are mediated in part by a delay in the recruitment of Plo1 to the SPB at mitotic entry. Plo1 activity supports mitotic SPB remodeling by driving a burst of incorporation of Cut12 and Pcp1. Thus, a fission yeast SUN-KASH complex plays an important role in supporting the remodeling of the SPB at mitotic entry.
Keywords: LINC complex; Nuclear envelope; Spindle pole body.
© 2014. Published by The Company of Biologists Ltd.
Figures
Fig. 1.
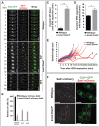
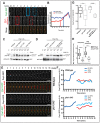
Kms2 localizes to the nuclear envelope–SPB interface and is essential during germination. (A) Kms2 and Sad1 colocalize at the SPB during interphase and mitosis. Representative time-lapse fluorescence micrographs over one cell division are shown. nmt41-GFP–Kms2 (green) and Sad1–mCherry (red) were visualized over the course of 84 min at 2-min intervals in EMM medium with a thiamine concentration of 25 ng/ml. (B) Thiamine addition causes Kms2 depletion. Schematic of the Kms2-knockdown allele (kms2 DAmP). GFP- or HA-tagged Kms2 is under the control of the thiamine-repressible nmt81 promoter. The 3′ UTR has also been disrupted to destabilize the mRNA. Fluorescent micrographs of cells expressing nmt81-GFP-Kms2 DAmP in the absence or presence of thiamine. Images are an average intensity projection (ten _Z_-sections with 0.5-µm spacing). Cell outlines are indicated by dashed white lines. (C) Quantification of nmt81-GFP-Kms2 DAmP fluorescence intensities at interphase SPBs from images acquired as in B. For box and whisker plots, the lower and upper sides of the box display the first and third quartile, and the band inside the box presents the median. The ends of the whiskers represent the minimum and maximum of all data. >100 cells were analyzed. A.U., arbitrary units. (D) Gene disruption of kms2 results in germination defects. Backcross of the kms2-ATG::ura4+ haploid strain to the wild-type strain gave rise to tetrads with a ratio of normal∶absent colonies of 2∶2. White bars indicate absent colonies. n = 9. Insets, images of the microcolonies formed upon germination of the _kms2-ATG::ura4+_-containing spores show representative brightfield micrographs of germinated spores, which often display increased cell length. (E) Kms2 contributes to mitotic entry. Differential interference contrast (DIC)-micrographs of cells harboring wild-type, kms2 DAmP and/or cdc25-22 alleles, grown at 25°C. Scale bars: 5 µm. (F) Quantification of cell length from images taken in E. Data are represented as the mean±s.e.m. (>100 cells); for C and F, ****P<0.0001 (unpaired two-tailed Student's _t_-test). (G) The repressed kms2 DAmP and cdc25-22 alleles are synthetically lethal at 34°C. Cells were grown at 25°C in YE5S, serially diluted tenfold, spotted onto YE5S plates and incubated at 25°C (5 days) or 34°C (2 days).
Fig. 2.
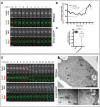
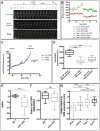
Kms2 supports stable bipolar spindle formation. (A) Kms2 depletion leads to spindle defects. Time-lapse images of wild-type or kms2 DAmP cells expressing GFP–Atb2 and Sad1–mCherry grown in medium containing thiamine. Representative mitotic spindle phenotypes are shown. SSP, spindle stabilization problem; MPS, monopolar spindle. t = 0 represents the time-point of SPB separation. Images were taken every 2 min and are shown as average intensity projections (eight _Z_-sections with 0.4-µm spacing). Red arrows indicate supernumerary Sad1 foci. (B) Quantification of the kms2 DAmP spindle phenotypes observed in A. Wild-type and kms2 DAmP cells expressing mCherry–Atb2 were binned by phenotype – normal, SSP or MPS. Data show the mean±s.d. (>50 cells in each group). (C) SPB separation is delayed with respect to loss of cytoplasmic microtubules in the kms2 DAmP mutant. The duration from the time-point at which microtubules depolymerize (MT depol) until SPB separation was measured in cells expressing Pcp1–GFP and mCherry–Atb2. (D) Loss of Kms2 leads to a delay before anaphase B. The duration from SPB separation and progression into anaphase B was measured in cells expressing Pcp1–GFP and mCherry–Atb2. For C and D, data show the mean±s.e.m. (>20 cells per group); **P = 0.0031, ****P<0.0001 (unpaired two-tailed Student's _t_-test). (E) Kms2 promotes stable spindle growth. Comparative plot of spindle length versus time for wild-type (blue) and kms2 DAmP (red) cells. In contrast to wild-type cells, some kms2 DAmP cells display repeated spindle collapses. The numbers of individual traces are referred to in the main text. (F) Supernumerary Sad1 foci that arise in the absence of Kms2 reside in the nuclear envelope (red arrows). Representative micrographs of wild-type or kms2 DAmP cells expressing Cut11–GFP (green) and Sad1–mCherry (red) grown in medium containing thiamine. All images are shown as maximum intensity projections (eight _Z_-sections with 0.4-µm spacing). Cell outlines are indicated by dashed white lines. Scale bars: 5 µm.
Fig. 3.
The timing of Cut11 recruitment to the SPB and SPB insertion are affected by the loss of Kms2. (A) Kms2 depletion delays but does not abrogate Cut11 incorporation into the SPB. Shown are representative time-lapse images at mitotic entry of wild-type or kms2 DAmP cells expressing Cut11–GFP (green) and Sad1–mCherry (red) in the presence of thiamine. t = 0 represents the time-point of SPB separation. (B) Loss of Kms2 affects the rate of Cut11 recruitment to the SPB. Quantification of fluorescence intensities of Cut11–GFP from the time-lapse experiment shown in A. (C) The t initial (time-point at which the recruitment of Cut11 begins relative to SPB separation; see Materials and Methods) is plotted. WT, wild-type. Box and whisker plots of the t initial for _n_>20 cells (boxes show the median, first and third quartiles; whiskers show the maximum and minimum). + indicates the mean of the data. ***P<0.001. (D) The loss of Kms2 delays anaphase B and leads to persistent nuclear envelope blebbing. Time-lapse images of the mitotic entry of wild-type or kms2 DAmP cells expressing Cut11–GFP (green) and Sad1–mCherry (red) in the presence of thiamine. The red box indicates the onset of anaphase B in wild-type cells, whereas the blue box marks the start of anaphase B in kms2 DAmP cells. Red arrows indicate a nuclear envelope bleb. Images were taken every minute and are shown as average intensity projections (ten _Z_-sections with 0.5-µm spacing). Cell outlines are indicated by dashed white lines. (E–G) kms2 DAmP cells show defects in stable SPB insertion into the nuclear envelope. kms2 DAmP cells were grown in thiamine-containing medium, fixed, embedded and processed for transmission electron microscopy. (E) A kms2 DAmP cell in early mitosis. N, nucleus; NE, nuclear envelope; NPC, nuclear pore complex. The dashed boxes show the locations of the insets shown in F and G. (F) SPB1 is within the nucleoplasm in association with a fenestra of the nuclear envelope (arrowheads). (G) SPB2 is retained in the cytoplasm near an open nuclear envelope fenestra. Arrowheads show the edges of the fenestration in the nuclear membrane. Scale bars: 5 µm (A,D) or as labeled (E–G).
Fig. 4.
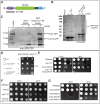
Kms2 interacts physically and genetically with SPB components. (A) Schematic of the Kms2 domain structure. An N-terminal EF-hand [amino acids (aa) 1–95; purple] is followed by a middle domain predicted to contain an extended coiled-coil domain (amino acids 96–384; green) and the KASH domain at the C-terminus, which also contains a transmembrane segment (TM; 385–457). (B) S. pombe proteins are specifically enriched on GST–Kms2 aa 1–95 beads. Recombinant GST–Kms2 fragment aa 1–95 or GST alone was immobilized on glutathione beads and incubated with a cryolysate. Interacting proteins were subjected to SDS-PAGE and Coomassie Blue staining. The bracket indicates the region excised for mass spectrometry. (C) The GST–Kms2 aa 1–95 domain interacts with the SPB components Pcp1 and Cut12. The experimental set-up was as described in B, except the cryolysates contained Cut12–CFP and Pcp1–GFP. Interacting proteins were subjected to SDS-PAGE followed by immunoblotting using an anti-GFP antibody. The asterisk indicates a non-specific band. (D) kms2 DAmP is synthetically lethal with the pcp1-18 allele. Three examples of tetratypes arising from a cross of kms2 DAmP and pcp1-18 incubated at the permissive temperature of 25°C. Genotypes are indicated by the legend on the left. The combination of the kms2 DAmP and pcp1-18 alleles is lethal (n = 8). (E,F) kms2 DAmP has a weaker synthetic effect on the pcp1-15 allele, whereas deletion of Kms1 suppresses pcp1-18. Genetic interactions between kms2 DAmP and pcp1-15 (E) or kms1Δ and pcp1-18 (F). Cells were grown at 25°C in YE5S, serially diluted tenfold, spotted onto YE5S plates and incubated at 25°C (5 days) or 36°C (2 days). (G) kms2 DAmP enhances the nda3 KM311 allele at the permissive temperature. Cells were grown at 30°C in YE5S, serially diluted tenfold, spotted onto YE5S plates and incubated at 25°C (5 days) or 30°C (3 days).
Fig. 5.
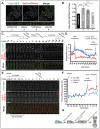
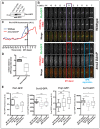
New Pcp1 is recruited to the daughter SPB shortly before SPB separation. (A) The ratio of Pcp1∶Sad1 at the SPB changes through the cell cycle. Fluorescence micrographs of an asynchronous cell culture expressing Pcp1–GFP and Sad1–mCherry. Cells were binned into approximate cell-cycle specific groups – mid/late G2 phase (1), mitosis (2), G1/S phase (3) and early G2 (4). Images are an average intensity projection (18 _Z_-sections with 0.3-µm spacing). (B) Quantification of the Pcp1∶Sad1 ratio of the bins assigned in A. The ratio of fluorescence intensity of Pcp1–GFP∶Sad1–mCherry at the SPB of mitotic cells (group 2) was set to 1. Data show the mean±s.e.m. (>80 cells in each group); ***P = 0.0002, ****P<0.0001 (unpaired two-tailed Student's _t_-test). (C) A burst of Pcp1 incorporation into the SPBs occurs just before mitotic division. Representative time-lapse fluorescence micrographs over two cell divisions. Pcp1–GFP (green) and Sad1–mCherry (red) were visualized as average intensity projections (ten _Z_-sections with 0.5-µm spacing) over the course of 240 min at 2-min intervals. Asterisks indicate bursts. (D) Quantification of the fluorescence intensity of the time-lapse experiment shown in C. Fluorescence intensity at the SPB of one cell expressing Pcp1–GFP (blue line) and Sad1–mCherry (red line) is shown. t = 0 represents the first SPB separation, after which time the upper SPB was analyzed. Asterisks indicate the bursts at G2/M. A.U., arbitrary units. (E) The burst of Pcp1 incorporation before mitotic division occurs primarily at the daughter SPB. Fluorescence recovery after photobleaching of a G2 cell expressing Pcp1–GFP that enters mitosis. The interphase SPB was bleached after the first image. Cdc7–mCherry, a marker of the daughter SPB in anaphase B, was clearly visible at time-point t = 16 (red circle). The cell was monitored every minute; images are an average intensity projection (12 _Z_-sections with 0.5-µm spacing). Cell outlines are indicated by dashed white lines. (F) Quantification of Pcp1–GFP recovery at the bleached SPB in E. The fluorescence of Pcp1–GFP at the SPB before the bleach was set to 100%. After SPB separation, the blue line represents the daughter SPB, whereas the red line is the mother SPB. Ten out of ten times, Cdc7–mCherry was at the SPB that displayed greater recovery of Pcp1–GFP. (G) A model of the Pcp1–GFP bleach experiment. After bleaching the interphase SPB, recovery of Pcp1 is not observed until 4 min before SPB separation, with the majority of new Pcp1 incorporated into the daughter (d) SPB. After separation, the daughter SPB contains mostly new detectable Pcp1–GFP, whereas the mother (M) SPB contains primarily older bleached Pcp1–GFP. Scale bars: 5 µm.
Fig. 6.
The Polo kinase Plo1 is required for mitotic phosphorylation of Pcp1 and regulates Pcp1 incorporation into the SPB. (A) Plo1 accumulates at the SPB before Pcp1 recruitment is initiated. Time-lapse fluorescence micrographs of a wild-type cell expressing Pcp1–GFP and Plo1–mCherry entering mitosis. Images are average intensity projections (eight _Z_-sections with 0.4-µm spacing) taken at 1-min intervals. Solid blue and red boxes indicate the time-point of initiation of recruitment; dashed boxes indicate the time-point of half-maximal recruitment. (B) Quantification of fluorescence intensities at the SPB of time-lapse experiment shown in A. t = 0 is set to 100% fluorescence intensity. _t_i, t initial (statistics are given in the text; see also Fig. 3). (C,D) Plo1 activity is required for Pcp1 phosphorylation at mitosis. Immunoblot of Pcp1–HA from mitotically arrested cells harboring either the nda3 KM311, plo1-24C or nda3 KM311/plo1.as8 alleles, as indicated. λ-phosphatase (PPase) was added as indicated. P-Pcp1–HA, phosphorylated Pcp1–HA. (E) Pcp1 incorporation is affected by loss of Plo1 function. Time-lapse images of Pcp1–GFP (green) and mCherry–Atb2 (red) in a wild-type or plo1-24C cell. Both strains were grown at 30°C and then shifted to 36°C for 90 min before imaging. Images were taken every minute and are shown as average intensity projections (ten _Z_-sections with 0.5-µm spacing). Cell outlines are indicated by dashed white lines. Scale bars: 5 µm. (F) After division, the intensity of Pcp1 at the SPBs is asymmetric in plo1-24C cells. Quantification of the time-lapse experiments shown in E. Fluorescence intensity of Pcp1–GFP in the single wild-type (upper graph) or _plo1-24C_-mutant (lower graph) cell was measured. The intensity of the SPBs circled in blue (SPB1) and red (SPB2) indicated at t = 1 are plotted. A.U., arbitrary units. (G) Quantification of the unequal distribution of Pcp1–GFP at SPB1 and SPB2 after division from a population of cells imaged as in E. The graph shows the ratio of Pcp1–GFP fluorescence intensities of SPB2∶SPB1 in wild-type and plo1-24C cells or plo1.as8 cells in the absence or presence of the inhibitor 3-BrB-PP1 (each group contains >20 cells), with the less intense SPB assigned as SPB2. (H) Less Pcp1 is associated with the SPB both during interphase and at SPB separation in plo1-24C cells. Quantification of Pcp1–GFP fluorescence intensity of interphase SPBs and SPBs just prior to division in wild-type and plo1-24C cells (_n_>30). All box and whiskers plots as in 1C. **P = 0.0061, ****P<0.0001 (unpaired two-tailed Student's _t_-test using Welch's correction when necessary).
Fig. 7.
Plo1 activity influences a burst of symmetric Cut12 incorporation into the SPB at mitotic entry. (A,B) A burst of Cut12 incorporation into the SPBs occurs just before mitotic division. Representative time-lapse fluorescence micrographs. Cut12–GFP (green) and Sad1–mCherry (red) were visualized as average intensity projections (ten _Z_-sections with 0.5-µm spacing) over the course of 60 min at 2-min intervals. Cell outlines are indicated by dashed white lines. Scale bars: 5 µm. (B) Quantification of fluorescence intensity of the time-lapse experiment shown in A is plotted. Fluorescence intensity of Cut12 (green tones) and Sad1 (red tones) at the G2 SPB (squares) and SPB1 and SPB2 after division (circles) as indicated in the legend. t = 0 is set as the time of SPB separation. A.U., arbitrary units. (C) Cut12–GFP is dynamic during G2 and is inherited equally into both SPBs after division. Fluorescence recovery after photobleaching was carried out on a G2 cell expressing Cut12–GFP that enters mitosis. The fluorescence of Cut12–GFP at the SPB before the bleach was set to 100% and recovery at the bleached SPB is plotted. After SPB separation, the two SPBs have similar intensity (cyan and red traces). WT, wild type. (D,E) Incorporation of Cut12 at mitotic entry is dependent on Plo1 activity. (D) Less Cut12 is associated with the SPB both at microtubule depolymerization (MT depol) and SPB separation in plo1-24C cells. Quantification of Cut12–GFP fluorescence intensity in wild-type and plo1-24C cells (_n_>30). (E) Comparison of the time from the beginning of the burst until SPB separation (t initial) for the same wild-type and plo1-24C cells. (F) Cut12–GFP is found equally in both SPBs after division. Graph shows the ratio of fluorescence intensities of SPB2∶SPB1 of Cut12–GFP in wild-type and plo1-24C cells (_n_>20). The SPB with the lower intensity is assigned as SPB2. (G) Summary of the timing of initial burst of recruitment for the indicated factors in wild-type cells. + indicates the mean. All box and whiskers plots are as described in 1C. *P<0.05; **P<0.01; ****P<0.0001; ns, not significant (unpaired two-tailed Student's _t_-test using Welch's correction when necessary).
Fig. 8.
Kms2 coordinates SPB remodeling at mitotic entry. (A) Kms2 interacts with Plo1. Binding assay of a cryolysate containing Plo1–GFP carried out as in Fig. 4B,C. aa, amino acids. (B) Recruitment of Plo1 to the SPB is delayed in cells harboring the kms2 DAmP allele. Time-lapse images of mitotic entry in wild-type or kms2 DAmP cells expressing Plo1–GFP (green) and mCherry–Atb2 (red) grown in medium containing thiamine. Images were taken every 1 min and are shown as average intensity projections (ten _Z_-sections with 0.5-µm spacing). The time of microtubule depolymerization (MT depol) is indicated by the red boxes and SPB separation is indicated by the blue boxes. Cell outlines are indicated by dashed white lines. Scale bars: 5 µm. (C,D) Loss of Kms2 affects the rate but not extent of Plo1 recruitment to the SPB. (C) Quantification of fluorescence intensities of Plo1–GFP from the time-lapse experiment shown in B. A.U., arbitrary units. (D) t initial values for Plo1–GFP in wild-type (WT) and kms2 DAmP cells were plotted as in Fig. 3C. (E) Less Plo1 and Cut12 are recruited at the time of microtubule depolymerization in kms2 DAmP cells, but the recruitment of these proteins reaches wild-type levels at SPB separation, whereas more Pcp1 and less Cut11 are incorporated at SPB separation. All box and whiskers plots are as described in 1C. ns, not significant; *P<0.05; **P<0.01; ***P<0.001 (unpaired two-tailed Student's _t_-test using Welch's correction when necessary).
Similar articles
- Physical and functional interactions between polo kinase and the spindle pole component Cut12 regulate mitotic commitment in S. pombe.
MacIver FH, Tanaka K, Robertson AM, Hagan IM. MacIver FH, et al. Genes Dev. 2003 Jun 15;17(12):1507-23. doi: 10.1101/gad.256003. Genes Dev. 2003. PMID: 12815070 Free PMC article. - Fission yeast Pcp1 links polo kinase-mediated mitotic entry to gamma-tubulin-dependent spindle formation.
Fong CS, Sato M, Toda T. Fong CS, et al. EMBO J. 2010 Jan 6;29(1):120-30. doi: 10.1038/emboj.2009.331. Epub 2009 Nov 26. EMBO J. 2010. PMID: 19942852 Free PMC article. - Spindle pole body components are reorganized during fission yeast meiosis.
Ohta M, Sato M, Yamamoto M. Ohta M, et al. Mol Biol Cell. 2012 May;23(10):1799-811. doi: 10.1091/mbc.E11-11-0951. Epub 2012 Mar 21. Mol Biol Cell. 2012. PMID: 22438582 Free PMC article. - The spindle pole body plays a key role in controlling mitotic commitment in the fission yeast Schizosaccharomyces pombe.
Hagan IM. Hagan IM. Biochem Soc Trans. 2008 Oct;36(Pt 5):1097-101. doi: 10.1042/BST0361097. Biochem Soc Trans. 2008. PMID: 18793196 Review. - Big Lessons from Little Yeast: Budding and Fission Yeast Centrosome Structure, Duplication, and Function.
Cavanaugh AM, Jaspersen SL. Cavanaugh AM, et al. Annu Rev Genet. 2017 Nov 27;51:361-383. doi: 10.1146/annurev-genet-120116-024733. Epub 2017 Sep 15. Annu Rev Genet. 2017. PMID: 28934593 Review.
Cited by
- Tell the Difference Between Mitosis and Meiosis: Interplay Between Chromosomes, Cytoskeleton, and Cell Cycle Regulation.
Sato M, Kakui Y, Toya M. Sato M, et al. Front Cell Dev Biol. 2021 Apr 8;9:660322. doi: 10.3389/fcell.2021.660322. eCollection 2021. Front Cell Dev Biol. 2021. PMID: 33898463 Free PMC article. Review. - Mixing and Matching Chromosomes during Female Meiosis.
Rubin T, Macaisne N, Huynh JR. Rubin T, et al. Cells. 2020 Mar 12;9(3):696. doi: 10.3390/cells9030696. Cells. 2020. PMID: 32178277 Free PMC article. Review. - Duplication and Nuclear Envelope Insertion of the Yeast Microtubule Organizing Centre, the Spindle Pole Body.
Rüthnick D, Schiebel E. Rüthnick D, et al. Cells. 2018 May 10;7(5):42. doi: 10.3390/cells7050042. Cells. 2018. PMID: 29748517 Free PMC article. Review. - Mechanisms of chromosome biorientation and bipolar spindle assembly analyzed by computational modeling.
Edelmaier C, Lamson AR, Gergely ZR, Ansari S, Blackwell R, McIntosh JR, Glaser MA, Betterton MD. Edelmaier C, et al. Elife. 2020 Feb 13;9:e48787. doi: 10.7554/eLife.48787. Elife. 2020. PMID: 32053104 Free PMC article. - Position matters: multiple functions of LINC-dependent chromosome positioning during meiosis.
Katsumata K, Nishi E, Afrin S, Narusawa K, Yamamoto A. Katsumata K, et al. Curr Genet. 2017 Dec;63(6):1037-1052. doi: 10.1007/s00294-017-0699-2. Epub 2017 May 10. Curr Genet. 2017. PMID: 28493118
References
- Bähler J., Wu J. Q., Longtine M. S., Shah N. G., McKenzie A., 3rd, Steever A. B., Wach A., Philippsen P., Pringle J. R. (1998b). Heterologous modules for efficient and versatile PCR-based gene targeting in Schizosaccharomyces pombe. Yeast 14, 943–951 10.1002/(SICI)1097--0061(199807)14:10<943::AID--YEA292>3.0.CO;2--Y - DOI - PubMed
Publication types
MeSH terms
Substances
LinkOut - more resources
Full Text Sources
Other Literature Sources
Molecular Biology Databases
Research Materials

