Combined autophagy and HDAC inhibition: a phase I safety, tolerability, pharmacokinetic, and pharmacodynamic analysis of hydroxychloroquine in combination with the HDAC inhibitor vorinostat in patients with advanced solid tumors - PubMed (original) (raw)
Clinical Trial
. 2014 Aug;10(8):1403-14.
doi: 10.4161/auto.29231. Epub 2014 May 20.
Monica Mita 2, John Sarantopoulos 1, Leslie Wood 1, Ravi K Amaravadi 3, Lisa E Davis 4, Alain C Mita 2, Tyler J Curiel 1, Claudia M Espitia 1, Steffan T Nawrocki 1, Francis J Giles 5, Jennifer S Carew 6
Affiliations
- PMID: 24991835
- PMCID: PMC4203517
- DOI: 10.4161/auto.29231
Clinical Trial
Combined autophagy and HDAC inhibition: a phase I safety, tolerability, pharmacokinetic, and pharmacodynamic analysis of hydroxychloroquine in combination with the HDAC inhibitor vorinostat in patients with advanced solid tumors
Devalingam Mahalingam et al. Autophagy. 2014 Aug.
Abstract
We previously reported that inhibition of autophagy significantly augmented the anticancer activity of the histone deacetylase (HDAC) inhibitor vorinostat (VOR) through a cathepsin D-mediated mechanism. We thus conducted a first-in-human study to investigate the safety, preliminary efficacy, pharmacokinetics (PK), and pharmacodynamics (PD) of the combination of the autophagy inhibitor hydroxychloroquine (HCQ) and VOR in patients with advanced solid tumors. Of 27 patients treated in the study, 24 were considered fully evaluable for study assessments and toxicity. Patients were treated orally with escalating doses of HCQ daily (QD) (d 2 to 21 of a 21-d cycle) in combination with 400 mg VOR QD (d one to 21). Treatment-related adverse events (AE) included grade 1 to 2 nausea, diarrhea, fatigue, weight loss, anemia, and elevated creatinine. Grade 3 fatigue and/or myelosuppression were observed in a minority of patients. Fatigue and gastrointestinal AE were dose-limiting toxicities. Six-hundred milligrams HCQ and 400 mg VOR was established as the maximum tolerated dose and recommended phase II regimen. One patient with renal cell carcinoma had a confirmed durable partial response and 2 patients with colorectal cancer had prolonged stable disease. The addition of HCQ did not significantly impact the PK profile of VOR. Treatment-related increases in the expression of CDKN1A and CTSD were more pronounced in tumor biopsies than peripheral blood mononuclear cells. Based on the safety and preliminary efficacy of this combination, additional clinical studies are currently being planned to further investigate autophagy inhibition as a new approach to increase the efficacy of HDAC inhibitors.
Keywords: autophagy; cancer; clinical trial; hydroxychloroquine; vorinostat.
Figures
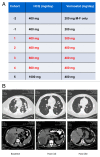
Figure 1. The combination of HCQ and vorinostat (VOR) induced a dramatic response in a patient with renal cell carcinoma (RCC). (A) Study dosing scheme. The dose of HCQ and VOR for each cohort are defined. Each cohort that was evaluated is indicated in red font. Patients were not enrolled in cohorts 1, 2 as dose de-escalation was not required. Enrollment in cohort 5 was not initiated based on dose-limiting toxicities (DLTs) that were observed in cohort 4. The dosing utilized for cohort 3 (600 mg HCQ + 400 mg VOR daily) was defined as the maximum tolerated dose (MTD). (B) Treatment with HCQ and VOR yielded a prolonged partial response in a patient with refractory RCC that has been durable for more than 50 cycles of therapy. MRI scans obtained at baseline and post cycles 10 and 50 (C10 and C50, respectively) are shown.
Figure 2. The addition of HCQ does not significantly impact the pharmacokinetic profile of VOR. (A) Quantification of whole blood concentrations of HCQ. HCQ concentrations were determined as described in Patients and Methods. HCQ levels for patients that received 400 mg and 600 mg HCQ are shown. *Indicates P < 0.05. (B) Serum concentrations of VOR. The concentrations of VOR in the serum of patients enrolled on the study were quantified as detailed in Patients and Methods. Plot shows the time dependence of serum VOR levels (concentration vs. time). Numbers indicate the subject number. Post-HCQ concentration curves are marked with a (0.1) after the patient number. (C) Comparison of VOR levels over time in specimens collected pre- and post-HCQ treatment. Pre-HCQ VOR concentrations are plotted on the left (n = 30), post-HCQ VOR levels are plotted on the right (n = 14). Wilcoxon Signed Rank testing determined that the time-dependence of VOR concentrations was not significantly affected by the addition of HCQ.
Figure 3. HCQ and VOR stimulate the expression of CTSD and CDKN1A and the accumulation of autophagic vacuoles. (A) Fold change from baseline in the levels of CTSD and CDKN1A in PBMC specimens in individual cohorts. PBMC specimens were collected at baseline and on C1D7. Gene expression was quantified by qRT-PCR and normalized to GAPDH. *Indicates a significant change from baseline, P < 0.05. (B) Tumor biopsies were obtained from 2 patients with colorectal cancer at baseline and on d 49 (Patient #1 = unmutated RAS, Patient #2 = mutant KRAS). The fold change from baseline in the levels of CTSD and CDKN1A expression in tumor specimens was quantified by qRT-PCR and normalized to GAPDH. *Indicates a significant change from baseline, P < 0.05. (C and D) Effects of treatment on autophagic vacuoles. PBMC specimens were collected from patients at baseline and post-treatment on d 7 and 49. Transmission electron microscopy was utilized to visualize and quantify autophagic vacuoles in PBMCs. The average number of autophagic vacuoles per cell for patients enrolled in the MTD cohort (cohort 3) is shown in (C). Representative images for one patient’s specimens collected at baseline, d 7 and d 49 are shown in (D).
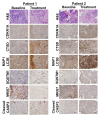
Figure 4. HCQ and VOR trigger intratumoral increases in the levels of CDKN1A, CTSD, and LC3-II. Effects of treatment on the expression of key biomarkers of HCQ and VOR in tumor specimens. Tumor biopsies were collected at baseline and post-treatment on d 49 from 2 patients with colorectal cancer (Patient #1 = unmutated RAS, Patient #2 = mutant KRAS). Immunohistochemistry was utilized to assess the levels of CDKN1A, CTSD, and LC3-II as described in Patients and Methods. Hematoxylin and eosin staining was conducted to visualize tumor architecture.
Figure 5. Quantification of the effects of treatment with HCQ and VOR on the expression of CDKN1A (A), CTSD (B), MAP1LC3B (C), SQSTM1 (D), MKI67 (E), and active CASP3 (F). *Indicates a significant change from baseline, P < 0.05.
Similar articles
- Vorinostat and hydroxychloroquine improve immunity and inhibit autophagy in metastatic colorectal cancer.
Patel S, Hurez V, Nawrocki ST, Goros M, Michalek J, Sarantopoulos J, Curiel T, Mahalingam D. Patel S, et al. Oncotarget. 2016 Sep 13;7(37):59087-59097. doi: 10.18632/oncotarget.10824. Oncotarget. 2016. PMID: 27463016 Free PMC article. - Phase I trial of hydroxychloroquine with dose-intense temozolomide in patients with advanced solid tumors and melanoma.
Rangwala R, Leone R, Chang YC, Fecher LA, Schuchter LM, Kramer A, Tan KS, Heitjan DF, Rodgers G, Gallagher M, Piao S, Troxel AB, Evans TL, DeMichele AM, Nathanson KL, O'Dwyer PJ, Kaiser J, Pontiggia L, Davis LE, Amaravadi RK. Rangwala R, et al. Autophagy. 2014 Aug;10(8):1369-79. doi: 10.4161/auto.29118. Epub 2014 May 20. Autophagy. 2014. PMID: 24991839 Free PMC article. Clinical Trial. - Combined MTOR and autophagy inhibition: phase I trial of hydroxychloroquine and temsirolimus in patients with advanced solid tumors and melanoma.
Rangwala R, Chang YC, Hu J, Algazy KM, Evans TL, Fecher LA, Schuchter LM, Torigian DA, Panosian JT, Troxel AB, Tan KS, Heitjan DF, DeMichele AM, Vaughn DJ, Redlinger M, Alavi A, Kaiser J, Pontiggia L, Davis LE, O'Dwyer PJ, Amaravadi RK. Rangwala R, et al. Autophagy. 2014 Aug;10(8):1391-402. doi: 10.4161/auto.29119. Epub 2014 May 20. Autophagy. 2014. PMID: 24991838 Free PMC article. Clinical Trial. - Vorinostat: A novel therapy for the treatment of cutaneous T-cell lymphoma.
Kavanaugh SM, White LA, Kolesar JM. Kavanaugh SM, et al. Am J Health Syst Pharm. 2010 May 15;67(10):793-7. doi: 10.2146/ajhp090247. Am J Health Syst Pharm. 2010. PMID: 20479100 Review. - Vorinostat in solid and hematologic malignancies.
Siegel D, Hussein M, Belani C, Robert F, Galanis E, Richon VM, Garcia-Vargas J, Sanz-Rodriguez C, Rizvi S. Siegel D, et al. J Hematol Oncol. 2009 Jul 27;2:31. doi: 10.1186/1756-8722-2-31. J Hematol Oncol. 2009. PMID: 19635146 Free PMC article. Review.
Cited by
- A novel autophagy/mitophagy inhibitor liensinine sensitizes breast cancer cells to chemotherapy through DNM1L-mediated mitochondrial fission.
Zhou J, Li G, Zheng Y, Shen HM, Hu X, Ming QL, Huang C, Li P, Gao N. Zhou J, et al. Autophagy. 2015;11(8):1259-79. doi: 10.1080/15548627.2015.1056970. Autophagy. 2015. PMID: 26114658 Free PMC article. - The crosstalk between sonodynamic therapy and autophagy in cancer.
Zhang Y, Zhao Y, Zhang Y, Liu Q, Zhang M, Tu K. Zhang Y, et al. Front Pharmacol. 2022 Aug 15;13:961725. doi: 10.3389/fphar.2022.961725. eCollection 2022. Front Pharmacol. 2022. PMID: 36046833 Free PMC article. Review. - Identification of 6-phosphofructo-2-kinase/fructose-2,6-bisphosphatase as a novel autophagy regulator by high content shRNA screening.
Strohecker AM, Joshi S, Possemato R, Abraham RT, Sabatini DM, White E. Strohecker AM, et al. Oncogene. 2015 Nov 5;34(45):5662-76. doi: 10.1038/onc.2015.23. Epub 2015 Mar 16. Oncogene. 2015. PMID: 25772235 Free PMC article. - Antitumor adaptive immunity remains intact following inhibition of autophagy and antimalarial treatment.
Starobinets H, Ye J, Broz M, Barry K, Goldsmith J, Marsh T, Rostker F, Krummel M, Debnath J. Starobinets H, et al. J Clin Invest. 2016 Dec 1;126(12):4417-4429. doi: 10.1172/JCI85705. Epub 2016 Oct 24. J Clin Invest. 2016. PMID: 27775547 Free PMC article. - Targeting Hedgehog signaling pathway and autophagy overcomes drug resistance of BCR-ABL-positive chronic myeloid leukemia.
Zeng X, Zhao H, Li Y, Fan J, Sun Y, Wang S, Wang Z, Song P, Ju D. Zeng X, et al. Autophagy. 2015;11(2):355-72. doi: 10.4161/15548627.2014.994368. Autophagy. 2015. PMID: 25701353 Free PMC article.
References
Publication types
MeSH terms
Substances
LinkOut - more resources
Full Text Sources
Other Literature Sources
Miscellaneous


