The skin immune atlas: three-dimensional analysis of cutaneous leukocyte subsets by multiphoton microscopy - PubMed (original) (raw)
The skin immune atlas: three-dimensional analysis of cutaneous leukocyte subsets by multiphoton microscopy
Philip L Tong et al. J Invest Dermatol. 2015 Jan.
Abstract
Site-specific differences in skin response to pathogens and in the course of cutaneous inflammatory diseases are well appreciated. The composition and localization of cutaneous leukocytes has been studied extensively using histology and flow cytometry. However, the precise three-dimensional (3D) distribution of distinct immune cell subsets within skin at different body sites requires visualization of intact living skin. We used intravital multiphoton microscopy in transgenic reporter mice in combination with quantitative flow cytometry to generate a 3D immune cell atlas of mouse skin. The 3D location of innate and adaptive immune cells and site-specific differences in the densities of macrophages, T cells, and mast cells at four defined sites (ear, back, footpad, and tail) is presented. The combinatorial approach further demonstrates an as yet unreported age-dependent expansion of dermal gamma-delta T cells. Localization of dermal immune cells relative to anatomical structures was also determined. Although dendritic cells were dispersed homogeneously within the dermis, mast cells preferentially localized to the perivascular space. Finally, we show the functional relevance of site-specific mast cell disparities using the passive cutaneous anaphylaxis model. These approaches are applicable to assessing immune cell variations and potential functional consequences in the setting of infection, as well as the pathogenesis of inflammatory skin conditions.
Conflict of interest statement
Conflict of Interest
None.
Figures
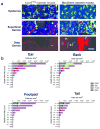
Figure 1. Deep tissue imaging by multiphoton microscopy demonstrates that spatial distribution of dermal leukocytes differ not only in depth but also between sites
(a) Intravital imaging of ear skin of Cxcr6+/gfp and _Csf1r_-EGFP (MacGreen) mice at various depths showing GFP+ cells (green) in the deep dermis (arrowheads), extracellular matrix in the dermis (SHG signals, blue) and blood vessels (Evans blue, red). Cartilage is visualized through autofluorescence (asterisk) (representative images from n = 2 mice per strain). Scale bar 50 μm. (b) Calculated densities of dermal dendritic cells (DDC), mast cells (MC), T cells and macrophages (Mac) at different sites, stratified by distance from the dermo-epidermal junction (DEJ). n = 3 for all strains; 6–12 fields of view per site, with flow cytometric adjustment for fluorescence expression with at least 12 mice per strain.
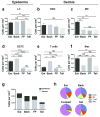
Figure 2. Topographical variation in leukocyte density in the epidermis and dermis
Comparison of leukocyte densities at various cutaneous sites, calculated using the combinatorial approach of MPM and flow cytometry. (a) Langerhans cells (LC) (b) dermal dendritic cells (DDC) (c) mast cells (MC) (d) dendritic epidermal T cells (DETC) (e) dermal T cells and (f) macrophages (Mac). (g) Density of epidermal and dermal leukocytes at various cutaneous sites and (h) proportion of indicated dermal leukocytes according to site. Data are mean ± S.E.M. (n = 3 for all strains, 6–12 fields of view per site, with flow cytometric adjustment for fluorescence expression with at least 12 mice per strain; one-way ANOVA with Tukey post-test). *P < 0.05, **P < 0.01, ***P < 0.001, ****P < 0.0001, ns, not significant.
Figure 3. Quantification of group 2 innate lymphoid cells and αβ and γδ T cells in ear skin of young and aged mice
(a) Representative (n > 8 per age group) image of GFP+ cells (green) in young (8–12 weeks) and older ear dermis (> 12 months) of Cxcr6+/gfp mice with ECM in dermis (SHG signals, blue) and dotted lines to indicate hair follicles. (b) Density of indicated populations in Cxcr6+/gfp mouse ear skin in mice 8–12 weeks old and greater than 12 months old. Results are pooled from three independent experiments (> 8 mice per age group). Data are mean ± S.E.M. and represent averaged flow-adjusted densities from both ears of each mouse. **P < 0.01, ns, not significant (unpaired t test). Scale bar 100 μm.
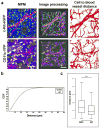
Figure 4. Customized automated cell to blood vessel distance analysis of a migratory and non-migratory dermal population
(a) Left: Representative intravital multiphoton microscopy (MPM) images of c-Kit-eGFP and CD11c-YFP ear skin showing GFP+ mast cells (MC; top, green), YFP+ dermal dendritic cells (DDC; bottom, yellow), extracellular matrix (SHG signals, blue) and vasculature (Evans blue, red). Middle: Computer-assisted recognition of cells (spots, yellow or green) and vasculature (purple). Right: Calculations of distances from every cell to nearest blood vessels (path in black). (b) Cumulative distribution function (CDF) of nearest distances of MC and DDC to vasculature in c-Kit-eGFP and CD11c-YFP mice respectively (in μm). (c) Box-whisker plot of cell to blood vessel distance in indicated populations (outliers excluded). n = 3 mice; 27 fields of view per strain; > 2000 cells examined; ****P < 0.0001 (Mann-Whitney U test). Scale bar 100 μm.
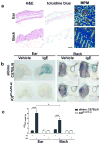
Figure 5. Site-specific differences in mast cell numbers quantified by multiphoton imaging and the passive cutaneous anaphylaxis functional assay
(a) Histology from albino C57BL/6_-Tyrc-2J_/J ear or back skin stained with H&E and toluidine blue; multiphoton microscopy (MPM) of c-Kit-eGFP ear or back skin demonstrating GFP+ mast cells (green), extracellular matrix (SHG signals, blue) and hair follicles (dotted lines). (b) Ear and back skin of albino C57BL/6_-Tyrc-2J_/J or mast cell-deficient C57BL/6J-_Kit_W-sh/W-sh mice treated with vehicle or IgE anti-DNP (i.d. injection site, dotted lines) and challenged 16 h later with i.v. DNP-HSA containing Evans blue dye. (c) Dye extravasation (weight adjusted) for indicated sites and strains quantified by absorption at 610 nm (One-way ANOVA with Dunnett’s post-test). Data are mean ± S.D.; *P < 0.05; ***_P_ <0.001. Scale bars 100 μm. Data representative of (a) 3 mice per strain, (b,c) > 3 mice per strain per site.
Similar articles
- Visualization of the T Cell Response in Contact Hypersensitivity.
Egawa G, Kabashima K. Egawa G, et al. Methods Mol Biol. 2017;1559:53-62. doi: 10.1007/978-1-4939-6786-5_4. Methods Mol Biol. 2017. PMID: 28063036 - Cutaneous immunosurveillance and regulation of inflammation by group 2 innate lymphoid cells.
Roediger B, Kyle R, Yip KH, Sumaria N, Guy TV, Kim BS, Mitchell AJ, Tay SS, Jain R, Forbes-Blom E, Chen X, Tong PL, Bolton HA, Artis D, Paul WE, Fazekas de St Groth B, Grimbaldeston MA, Le Gros G, Weninger W. Roediger B, et al. Nat Immunol. 2013 Jun;14(6):564-73. doi: 10.1038/ni.2584. Epub 2013 Apr 21. Nat Immunol. 2013. PMID: 23603794 Free PMC article. - A three-dimensional atlas of human dermal leukocytes, lymphatics, and blood vessels.
Wang XN, McGovern N, Gunawan M, Richardson C, Windebank M, Siah TW, Lim HY, Fink K, Yao Li JL, Ng LG, Ginhoux F, Angeli V, Collin M, Haniffa M. Wang XN, et al. J Invest Dermatol. 2014 Apr;134(4):965-974. doi: 10.1038/jid.2013.481. Epub 2013 Nov 11. J Invest Dermatol. 2014. PMID: 24352044 Free PMC article. - [Multiphoton microscopy and in vivo tomography in dermatologic imaging].
Kaatz M, König K. Kaatz M, et al. Hautarzt. 2010 May;61(5):397-409. doi: 10.1007/s00105-009-1880-4. Hautarzt. 2010. PMID: 20396860 Review. German. - Intravital imaging of cutaneous immune responses.
Nakamizo S, Egawa G, Tan KJ, Kabashima K. Nakamizo S, et al. Cell Immunol. 2020 Apr;350:103813. doi: 10.1016/j.cellimm.2018.05.006. Epub 2018 May 26. Cell Immunol. 2020. PMID: 29807622 Review.
Cited by
- Unveiling and Characterizing Early Bilateral Interactions between Biofilm and the Mouse Innate Immune System.
Forestier C, Billard E, Milon G, Gueirard P. Forestier C, et al. Front Microbiol. 2017 Nov 21;8:2309. doi: 10.3389/fmicb.2017.02309. eCollection 2017. Front Microbiol. 2017. PMID: 29209305 Free PMC article. Review. - Neutrophil Recruitment: From Model Systems to Tissue-Specific Patterns.
Margraf A, Ley K, Zarbock A. Margraf A, et al. Trends Immunol. 2019 Jul;40(7):613-634. doi: 10.1016/j.it.2019.04.010. Epub 2019 Jun 4. Trends Immunol. 2019. PMID: 31175062 Free PMC article. Review. - T cell-attracting CCL18 chemokine is a dominant rejection signal during limb transplantation.
Borges TJ, Abarzua P, Gassen RB, Kollar B, Lima-Filho M, Aoyama BT, Gluhova D, Clark RA, Islam SA, Pomahac B, Murphy GF, Lian CG, Talbot SG, Riella LV. Borges TJ, et al. Cell Rep Med. 2022 Mar 15;3(3):100559. doi: 10.1016/j.xcrm.2022.100559. eCollection 2022 Mar 15. Cell Rep Med. 2022. PMID: 35492875 Free PMC article. - Choreographing Immunity in the Skin Epithelial Barrier.
Kobayashi T, Naik S, Nagao K. Kobayashi T, et al. Immunity. 2019 Mar 19;50(3):552-565. doi: 10.1016/j.immuni.2019.02.023. Immunity. 2019. PMID: 30893586 Free PMC article. Review. - Intravital imaging of host-parasite interactions in skin and adipose tissues.
De Niz M, Meehan GR, Brancucci NMB, Marti M, Rotureau B, Figueiredo LM, Frischknecht F. De Niz M, et al. Cell Microbiol. 2019 May;21(5):e13023. doi: 10.1111/cmi.13023. Epub 2019 Apr 3. Cell Microbiol. 2019. PMID: 30825872 Free PMC article. Review.
References
- Bergstresser PR, Toews GB, Streilein JW. Natural and perturbed distributions of Langerhans cells: responses to ultraviolet light, heterotopic skin grafting, and dinitrofluorobenzene sensitization. J Invest Dermatol. 1980;75(1):73–7. - PubMed
- Bos JD, editor. Skin Immune System: Cutaneous Immunology and Clinical Immunodermatology. 3. CRC Press; 2004. p. 840.
Publication types
MeSH terms
Substances
LinkOut - more resources
Full Text Sources
Other Literature Sources
Molecular Biology Databases


