DNA damage triggers SAF-A and RNA biogenesis factors exclusion from chromatin coupled to R-loops removal - PubMed (original) (raw)
DNA damage triggers SAF-A and RNA biogenesis factors exclusion from chromatin coupled to R-loops removal
Sébastien Britton et al. Nucleic Acids Res. 2014 Aug.
Abstract
We previously identified the heterogeneous ribonucleoprotein SAF-A/hnRNP U as a substrate for DNA-PK, a protein kinase involved in DNA damage response (DDR). Using laser micro-irradiation in human cells, we report here that SAF-A exhibits a two-phase dynamics at sites of DNA damage, with a rapid and transient recruitment followed by a prolonged exclusion. SAF-A recruitment corresponds to its binding to Poly(ADP-ribose) while its exclusion is dependent on the activity of ATM, ATR and DNA-PK and reflects the dissociation from chromatin of SAF-A associated with ongoing transcription. Having established that SAF-A RNA-binding domain recapitulates SAF-A dynamics, we show that this domain is part of a complex comprising several mRNA biogenesis proteins of which at least two, FUS/TLS and TAFII68/TAF15, exhibit similar biphasic dynamics at sites of damage. Using an original reporter for live imaging of DNA:RNA hybrids (R-loops), we show a transient transcription-dependent accumulation of R-loops at sites of DNA damage that is prolonged upon inhibition of RNA biogenesis factors exclusion. We propose that a new component of the DDR is an active anti-R-loop mechanism operating at damaged transcribed sites which includes the exclusion of mRNA biogenesis factors such as SAF-A, FUS and TAF15.
© The Author(s) 2014. Published by Oxford University Press on behalf of Nucleic Acids Research.
Figures
Figure 1.
SAF-A dynamics in response to laser micro-irradation. (A) Map of SAF-A domains and of the truncations used. The main domains are as follows: the DNA-binding domain (DBD) that contains a SAP motif, a nuclear localization sequence (NLS), a SPRY (SPore lysis A and RYanodine receptor) domain and the RNA-binding domain (RBD) that contains an RGG motif. The phosphorylation site (S59) is indicated by a black arrow. WT: wild-type SAF-A; dDBD: deletion of the DNA-binding domain; dRBD: deletion of the RNA-binding domain; RBD: SAF-A RNA-binding domain only. (B) SAF-A-GFP behavior after 800-nm pulsed-laser nuclear irradiation assessed in HT1080 cells by live cell imaging at the indicated time post-irradiation in the presence or not of PARPi (DPQ). The white arrows mark the irradiated areas. Scale bar, 20 μm. (C) Dynamics of SAF-A-GFP at laser-damaged sites. Images were obtained at 22-s intervals, and fluorescence intensities at the damage sites were quantified. Mean values of the fluorescence intensities with SEM were calculated from 22 independent measurements. (D) Dynamics of SAF-A-GFP at laser-damaged sites in the presence of PARPi (DPQ or NU1025). Images were obtained at 22-s intervals, and fluorescence intensities at the damage sites were quantified. Mean values of the fluorescence intensities with SEM were calculated from 11 independent measurements under each condition. (E) PAR-binding assay. FLAG-GFP (Ctrl) or the indicated FLAG-GFP tagged forms of SAF-A were purified from transiently transfected HEK293T cells, separated on SDS-PAGE and transferred on membrane. The membrane was stained with Ponceau S to assess the quality of the purification. After incubation with purified PAR, retained PAR was detected using anti-PAR antibody. After stripping, an anti-GFP immunodetection was performed.
Figure 2.
Analysis of SAF-A exclusion from chromatin following DNA damage. (A) Colocalization of SAF-A-GFP exclusion areas and γH2AX at stripes of laser damage 10 min after micro-irradiation in HT1080 cells. Scale bar, 20 μm. (B) Analysis by immunofluorescence of endogenous SAF-A and γH2AX 10 min after laser micro-irradiation in HT1080 cells. Scale bar, 20 μm. (C) HT1080 cells were mock-treated or treated with Cali for 1 h, fractionated as described in the Materials and Methods section, leading to fractions 1–4 (F1–F4) corresponding to proteins of decreasing solubility. Protein samples were denatured and separated on SDS-PAGE gel, followed by electrotransfer and blotting as indicated. (D) HT1080 cells grown on glass slides were mock-treated or treated with 10-nM Cali for 1 h at 37°C in medium. Cells were pre-extracted or not with Triton X-100 prior to fixation. Then cells were immunostained with anti-SAF-A primary and appropriate secondary antibodies and the DNA stained with propidium iodide. Scale bar, 20 μm. (E) Dynamics of various forms of SAF-A-GFP at laser-damaged sites. Images were obtained at 22-s intervals, and fluorescence intensities at the damage sites were quantified. Mean values of the fluorescence intensities with SEM were calculated from 26, 24, 29 and 16 independent measurements for RBD, WT, dDBD and dRBD forms, respectively. WT: wild-type SAF-A; RBD-only: SAF-A RNA-binding domain; dDBD: DNA-binding domain deletion; dRBD: RNA-binding domain deletion.
Figure 3.
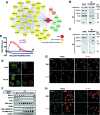
Identification of SAF-A RBD partners and analysis of their dynamics in response to DNA damage. (A) Interaction landscape representing proteins reproducibly co-immunoprecipitated with the RBD domain of SAF-A. (B,C) Co-immunoprecipitation analysis in extracts from HT1080 cells stably expressing FLAG-GFP, SAF-A-RBD-FLAG-GFP or FUS-FLAG-GFP. Immunoprecipitates were loaded on SDS-PAGE gel, followed by electrotransfer and blotting as indicated. (D) Effect of PARPi (DPQ) on the dynamics of FUS-GFP at laser-damaged sites. Images were obtained at 60-s intervals, and fluorescence intensities at the damage sites were quantified. Mean values of the fluorescence intensities with SEM were calculated from 30 and 20 independent measurements for conditions without and with PARPi, respectively. (E) Analysis by immunofluorescence of endogenous TAF15 and γH2AX 5 and 25 min after laser micro-irradiation in HT1080 cells. (F) HT1080 cells were mock-treated or treated with increase doses of Cali for 1 h, fractionated as described in the Materials and Methods section, leading to fractions 1–4 (F1–F4). Protein samples from fraction F4 were denatured and separated on SDS-PAGE gel, followed by electrotransfer and blotting as indicated. (G,H) HT1080 cells grown on glass slides were mock-treated or treated with 10-nM Cali for 1 h at 37°C in medium. Cells were pre-extracted or not with Triton X-100 prior to fixation. Then cells were immunostained with anti-FUS (G) or anti-TAF15 (H) primary and appropriate secondary antibodies and the DNA stained with propidium iodide. Scale bar, 20 μm.
Figure 4.
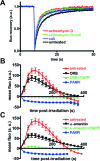
Effect of transcription inhibition on SAF-A mobility and dynamics in response to DNA damage. (A) Effect of DNA damage by calichemicin γ1 (Cali) and/or transcription inhibition (actinomycin D) on FRAP curve for SAFA-GFP. Images were obtained at 487-ms intervals. The data were normalized to the prebleach fluorescence level. The graph shows FRAP curves of mean values with SEM of 52, 52, 28 and 52 independent fluorescence measurements for conditions with actinomycin D, actinomycin D + Cali, Cali and no agent, respectively. (B) Effect of a PARPi (DPQ) and a transcription inhibitor (DRB) on the dynamics of SAF-A-GFP at laser-damaged sites. Images were obtained at 22-s intervals, and fluorescence intensities at the damage sites were quantified. Mean values of the fluorescence intensities with SEM were calculated from 12, 14, 17 and 17 independent measurements for conditions without inhibitor and with DRB, DRB+PARPi and PARPi, respectively. (C) Effect of a PARPi (DPQ) and a transcription inhibitor (α-amanitin) on the dynamics of SAF-A-GFP at laser-damaged sites. Images were obtained at 22-s intervals, and fluorescence intensities at the damage sites were quantified. Mean values of the fluorescence intensities with SEM were calculated from 12, 17, 17 and 25 independent measurements for conditions without inhibitor and with α-amanitin, α-amanitin+PARPi and PARPi, respectively.
Figure 5.
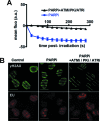
Effect of inhibitors of phosphatidylinositol 3-kinase-related kinases (PIKKs) on SAF-A exclusion from and transcription at laser damage sites. (A) Dynamics of SAF-A-GFP at laser-damaged sites was measured in the presence of a PARPi (DPQ) and without or with the combination of PIKKs inhibitors NU7441 (PKi, DNA-PK inhibitor), KU55933 (ATMi, ATM inhibitor) and VE821 (ATRi, ATR inhibitor). Images were obtained at 22-s intervals, and fluorescence intensities at the damage sites were quantified. Mean values of the fluorescence intensities with SEM were calculated from 16 and 39 independent measurements for conditions without and with PIKKs inhibitors, respectively. (B) Monitoring transcription following laser irradiation by incorporation of EU in HT1080 cells in the presence of PARPi (DPQ) and PIKKs inhibitors. Irradiation stripes were visualized by γH2AX immunostaining (note the strong decrease on PIKKs inhibition). Scale bar, 20 μm.
Figure 6.
(A) Colocalization of mutant RNaseHI and γH2AX at stripes of laser damage 1 min after micro-irradiation in HT1080 cells. Scale bar, 20 μm. (B) Dynamics of mutant RNaseHI at laser-damaged sites in HT1080 cells was measured in the presence of a combination of PARPi (DPQ), PIKKs inhibitors and transcription inhibitor (actinomycin D) as indicated. Images were obtained at 22-s intervals, and fluorescence intensities at the damage sites were quantified. Mean values of the fluorescence intensities with SEM were calculated from 48, 35, 47 and 31 independent measurements for conditions with no agent, PARPi (DPQ), PARPi and PIKKs inhibitors (PARPi/ATMi/PKi/ATRi) and the combination of PARPi, PIKKs and transcription inhibitors (PARPi/ATMi/PKi/ATRi+ actinomycin D), respectively. (C) Analysis by western blot of the kinetics of expression of mCherry (Ctrl, control) and mCherry-wild-type (WT) or mutant (Mut) RNaseHI in U2OS cells treated with doxycycline for 24 h. Ku80 is used as loading control. (D) Dynamics of WT or mutant RNaseHI at laser-damaged sites was measured in the presence or not of PARPi (DPQ) as indicated, in U2OS cells pretreated with doxy for 20 h. Images were obtained at 7.75-s intervals, and fluorescence intensities at the damage sites were quantified. Mean values of the fluorescence intensities with SEM were calculated from 23, 15, 25 and 10 independent measurements for conditions with mutant RNaseHI + PARPi, mutant RNaseHI, WT RNaseHI + PARPi and WT RNaseHI, respectively. (E) Exponentially growing HT1080 cells expressing mutant RNaseHI or mCherry as control (Ctrl) were exposed to the indicated dose of X-rays. Surviving cell population was measured after 5 days by cell staining. Each point represents the mean of six experiments ± SD. (F) U2OS cells containing a construct for inducible expression of mutant RNaseHI or mCherry as control (Ctrl) were preincubated or not with doxycycline for 16 h (+Dox) and then irradiated with the indicated dose of X-rays. Cell viability was measured after 6 days with the MTT assay. Each point represents the mean of four experiments ± SD.
Similar articles
- The role of SAF-A/hnRNP U in regulating chromatin structure.
Marenda M, Lazarova E, Gilbert N. Marenda M, et al. Curr Opin Genet Dev. 2022 Feb;72:38-44. doi: 10.1016/j.gde.2021.10.008. Epub 2021 Nov 22. Curr Opin Genet Dev. 2022. PMID: 34823151 Review. - PARP-1 dependent recruitment of the amyotrophic lateral sclerosis-associated protein FUS/TLS to sites of oxidative DNA damage.
Rulten SL, Rotheray A, Green RL, Grundy GJ, Moore DA, Gómez-Herreros F, Hafezparast M, Caldecott KW. Rulten SL, et al. Nucleic Acids Res. 2014 Jan;42(1):307-14. doi: 10.1093/nar/gkt835. Epub 2013 Sep 18. Nucleic Acids Res. 2014. PMID: 24049082 Free PMC article. - SAF-A Regulates Interphase Chromosome Structure through Oligomerization with Chromatin-Associated RNAs.
Nozawa RS, Boteva L, Soares DC, Naughton C, Dun AR, Buckle A, Ramsahoye B, Bruton PC, Saleeb RS, Arnedo M, Hill B, Duncan RR, Maciver SK, Gilbert N. Nozawa RS, et al. Cell. 2017 Jun 15;169(7):1214-1227.e18. doi: 10.1016/j.cell.2017.05.029. Cell. 2017. PMID: 28622508 Free PMC article. - The RNA-binding protein fused in sarcoma (FUS) functions downstream of poly(ADP-ribose) polymerase (PARP) in response to DNA damage.
Mastrocola AS, Kim SH, Trinh AT, Rodenkirch LA, Tibbetts RS. Mastrocola AS, et al. J Biol Chem. 2013 Aug 23;288(34):24731-41. doi: 10.1074/jbc.M113.497974. Epub 2013 Jul 5. J Biol Chem. 2013. PMID: 23833192 Free PMC article. - Biochemical Properties and Biological Functions of FET Proteins.
Schwartz JC, Cech TR, Parker RR. Schwartz JC, et al. Annu Rev Biochem. 2015;84:355-79. doi: 10.1146/annurev-biochem-060614-034325. Epub 2014 Dec 8. Annu Rev Biochem. 2015. PMID: 25494299 Free PMC article. Review.
Cited by
- R-loop: an emerging regulator of chromatin dynamics.
Al-Hadid Q, Yang Y. Al-Hadid Q, et al. Acta Biochim Biophys Sin (Shanghai). 2016 Jul;48(7):623-31. doi: 10.1093/abbs/gmw052. Epub 2016 Jun 1. Acta Biochim Biophys Sin (Shanghai). 2016. PMID: 27252122 Free PMC article. Review. - Proteostasis Regulators Restore Function of Epilepsy-Associated GABAA Receptors.
Di XJ, Wang YJ, Cotter E, Wang M, Whittsette AL, Han DY, Sangwung P, Brown R, Lynch JW, Keramidas A, Mu TW. Di XJ, et al. Cell Chem Biol. 2021 Jan 21;28(1):46-59.e7. doi: 10.1016/j.chembiol.2020.08.012. Epub 2020 Sep 3. Cell Chem Biol. 2021. PMID: 32888501 Free PMC article. - RNA-mediated gene fusion in mammalian cells.
Gupta SK, Luo L, Yen L. Gupta SK, et al. Proc Natl Acad Sci U S A. 2018 Dec 26;115(52):E12295-E12304. doi: 10.1073/pnas.1814704115. Epub 2018 Dec 11. Proc Natl Acad Sci U S A. 2018. PMID: 30538195 Free PMC article. - Spatiotemporal Control of CNS Myelination by Oligodendrocyte Programmed Cell Death through the TFEB-PUMA Axis.
Sun LO, Mulinyawe SB, Collins HY, Ibrahim A, Li Q, Simon DJ, Tessier-Lavigne M, Barres BA. Sun LO, et al. Cell. 2018 Dec 13;175(7):1811-1826.e21. doi: 10.1016/j.cell.2018.10.044. Epub 2018 Nov 29. Cell. 2018. PMID: 30503207 Free PMC article. - Transcription-mediated replication hindrance: a major driver of genome instability.
Gómez-González B, Aguilera A. Gómez-González B, et al. Genes Dev. 2019 Aug 1;33(15-16):1008-1026. doi: 10.1101/gad.324517.119. Epub 2019 May 23. Genes Dev. 2019. PMID: 31123061 Free PMC article. Review.
References
- Jeggo P., Lavin M.F. Cellular radiosensitivity: how much better do we understand it? Int. J. Radiat. Biol. 2009;85:1061–1081. - PubMed
- O'Driscoll M., Jeggo P.A. The role of double-strand break repair—insights from human genetics. Nat. Rev. Genet. 2006;7:45–54. - PubMed
Publication types
MeSH terms
Substances
LinkOut - more resources
Full Text Sources
Other Literature Sources
Molecular Biology Databases
Research Materials
Miscellaneous


